As enterprises continue to optimize and consolidate various legacy IT solutions, managing and analyzing logs from existing log sources becomes more critical and complex.
The new Dynatrace Logs app, fully powered by Grail™ data lakehouse, significantly enhances the experience for novice and seasoned users. Logs delivers unparalleled simplicity with powerful, sharable views and insights to address these needs.
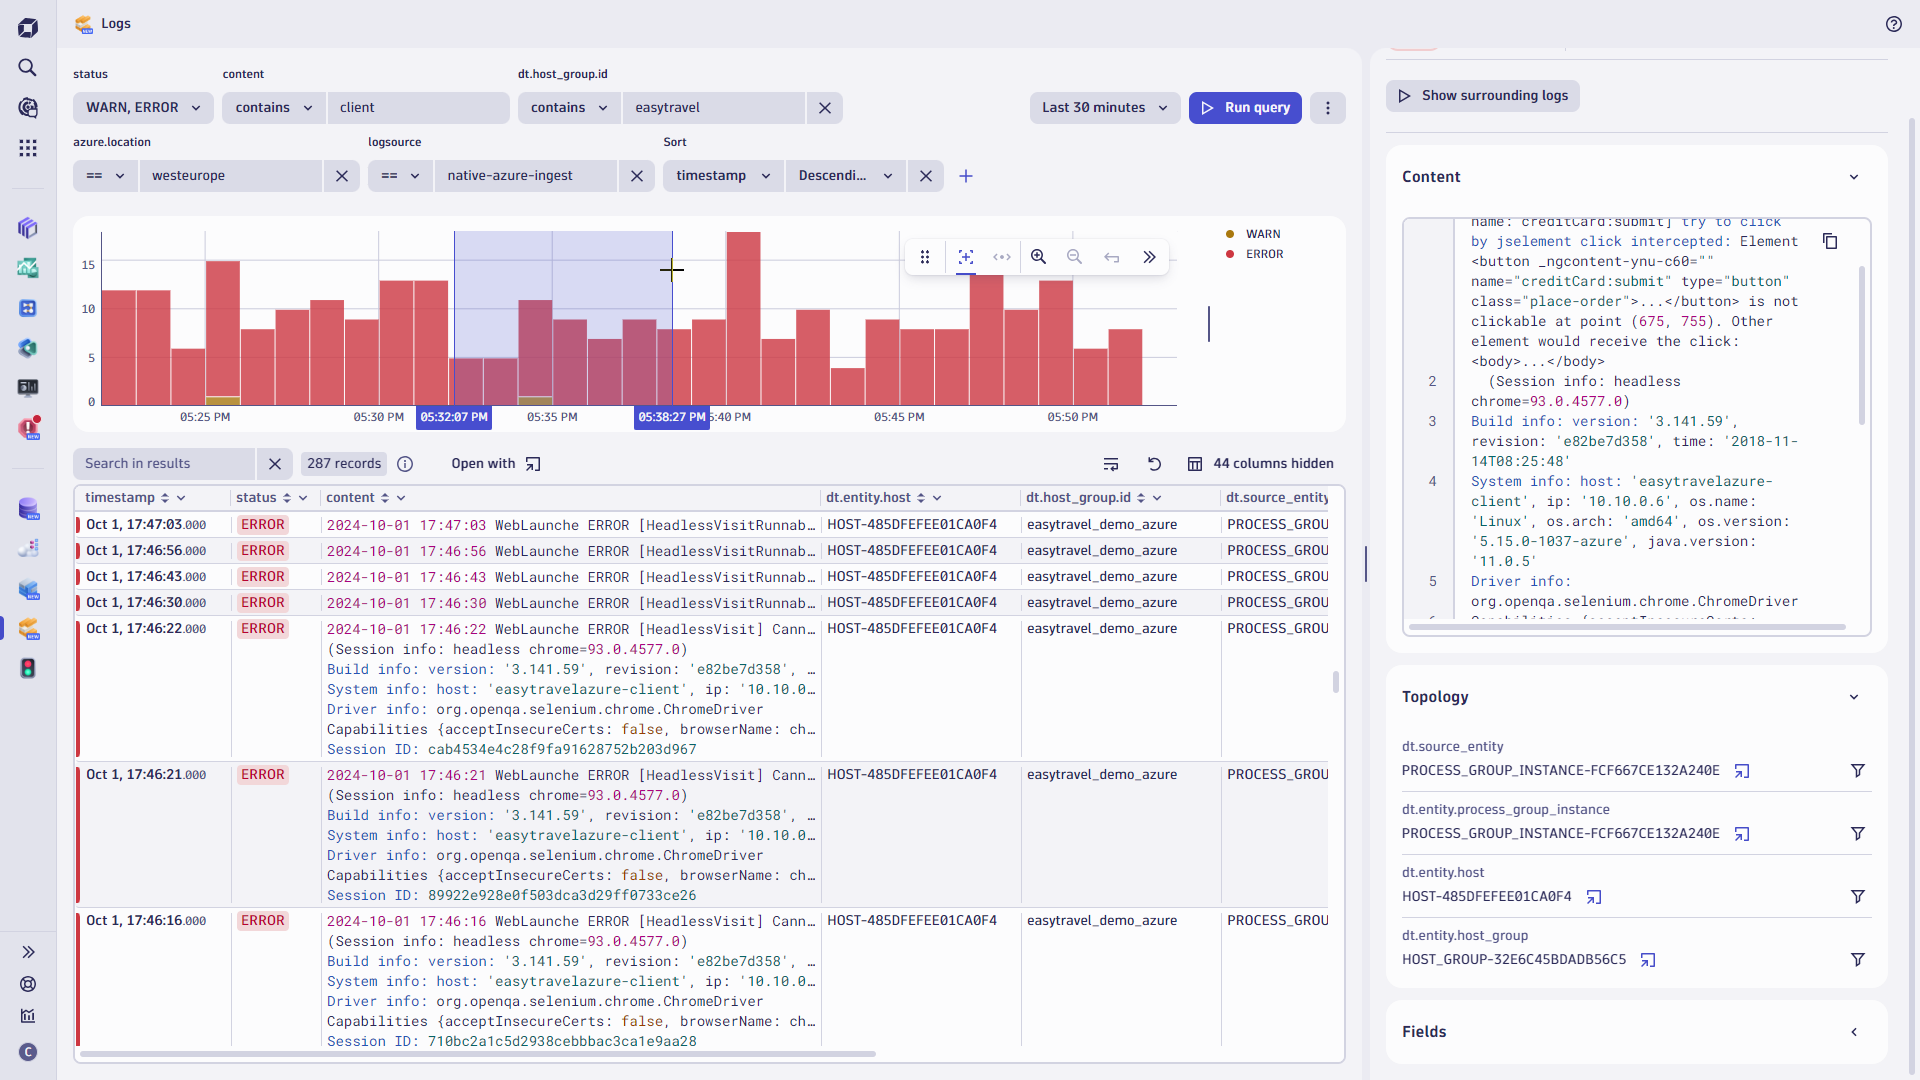 Figure 1. The menu bar of the new Logs app provides simple click-to-filter options. You can select single log lines to surface more insights in the details pane and further click-to-filter options.
Enhanced log ingestion and seamless out-of-the-box integration
The Logs app is supported by comprehensive log ingestion capabilities provided by the Dynatrace platform and Dynatrace Grail while interwoven with other use-case-specific Dynatrace Apps:
| Hybrid | Cloud Native | Logs in Dynatrace App Context |
| OneAgent | Amazon Kinesis Data Firehose | Clouds |
| OpenTelemetry | Amazon Log Forwarder | Infrastructure & Operations |
| Syslog | Azure Native Dynatrace Service integration | Kubernetes |
| Log Ingest API | Azure Log Forwarder | Databases |
| Logstash | Google Cloud logs | Application Security |
While this is just an overview of the commonly used ingest routes and methods you can leverage, the Dynatrace Hub offers the complete set, currently with 500 supported technologies, 150 additional public extensions, and 65 Dynatrace Apps.
Harness log source sprawl
It’s common for large enterprises to provide hundreds of applications to employees and to host more than a dozen critical line-of-business applications. “Digital workers are now demanding IT support to be more proactive,” is a quote from last year’s Gartner Survey
Understandably, a higher number of log sources and exponentially more log lines would overwhelm any DevOps, SRE, or Software Developer working with traditional log monitoring solutions. The Dynatrace logs in context and surrounding logs features ensure that Dynatrace users are provided with a view that’s tailored to their needs and supports their daily tasks.
The Logs app enables Dynatrace users, whether novice or experienced power users, to rapidly filter and investigate results manually within the app or experience a seamless drill-down handover from use-case-specific apps.
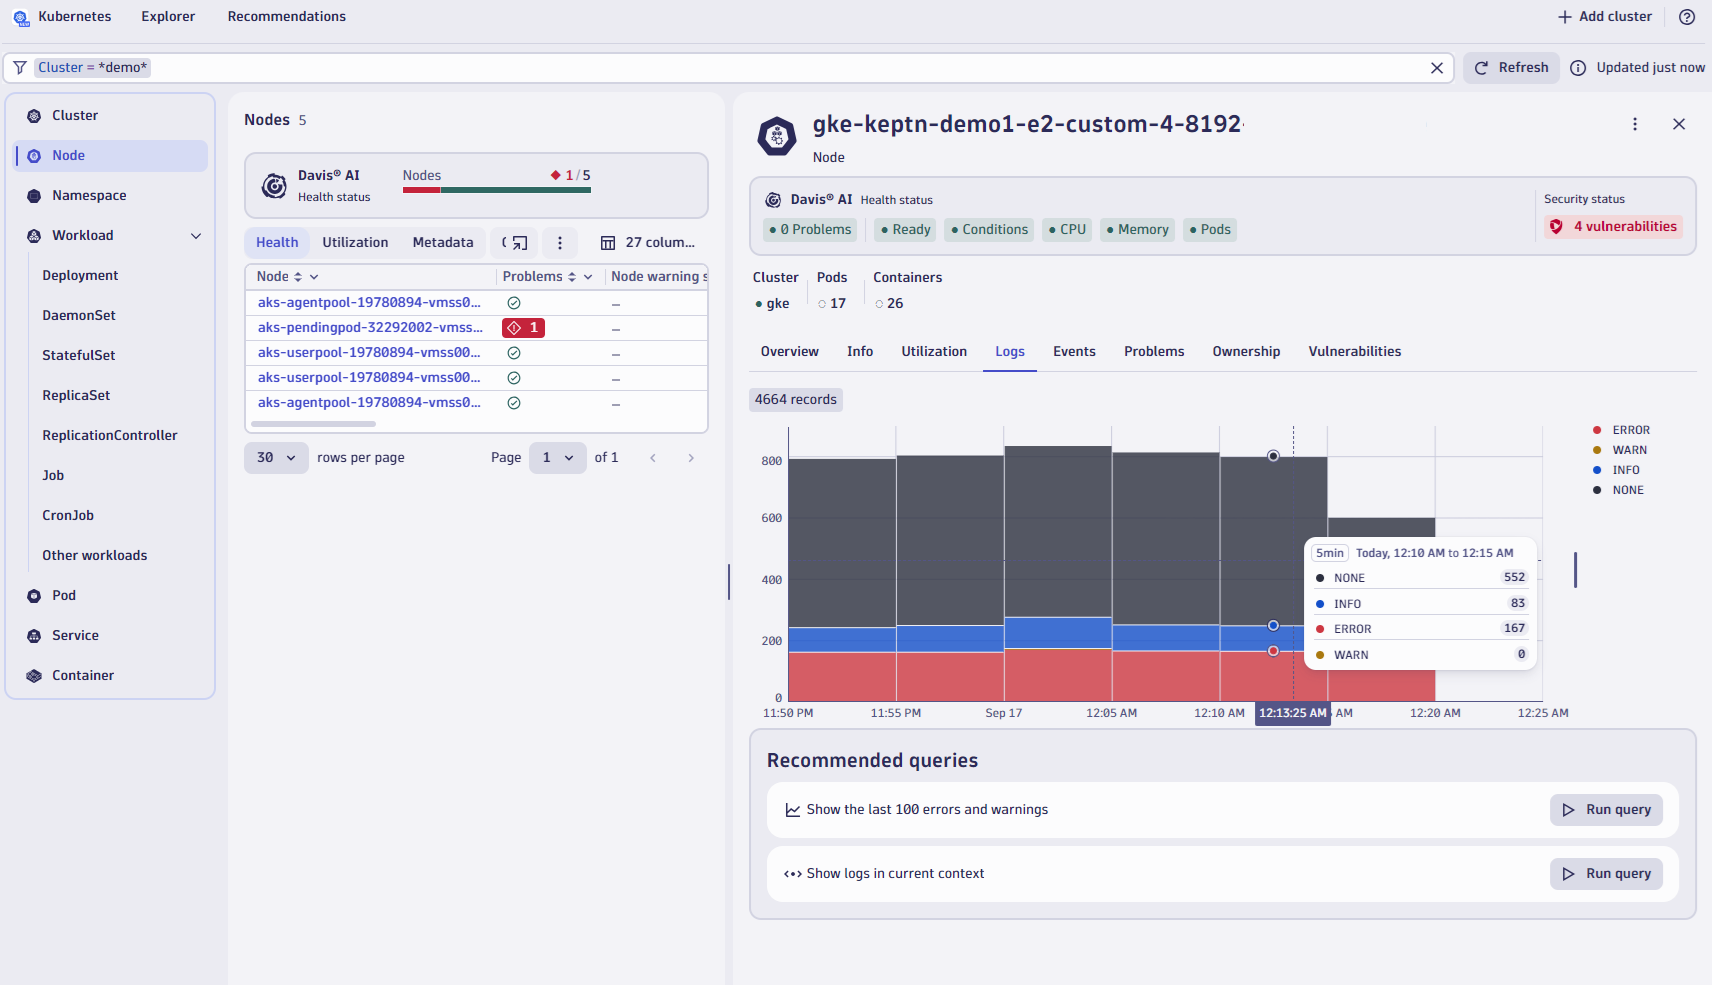 Figure 2. Logs are presented in the context of the applications that generate them, with the capability to run queries and open queried log entries directly in the Logs app.
Whether it’s cloud applications, infrastructure, or even security events, this capability accelerates time to value by surfacing logs that provide the crucial context of what occurred just before an error line was logged. For example, if one of your customers unexpectedly uploaded a 1 GB file instead of a 1 MB file, was there an error with the buffer overflowing, or was the network stack unable to handle the unexpected load? Even more importantly, how was the error handled, and did the process end successfully for the customer? With Dynatrace and Surrounding logs, answers to such questions are never more than a click away, with no need to write complex queries or patterns.
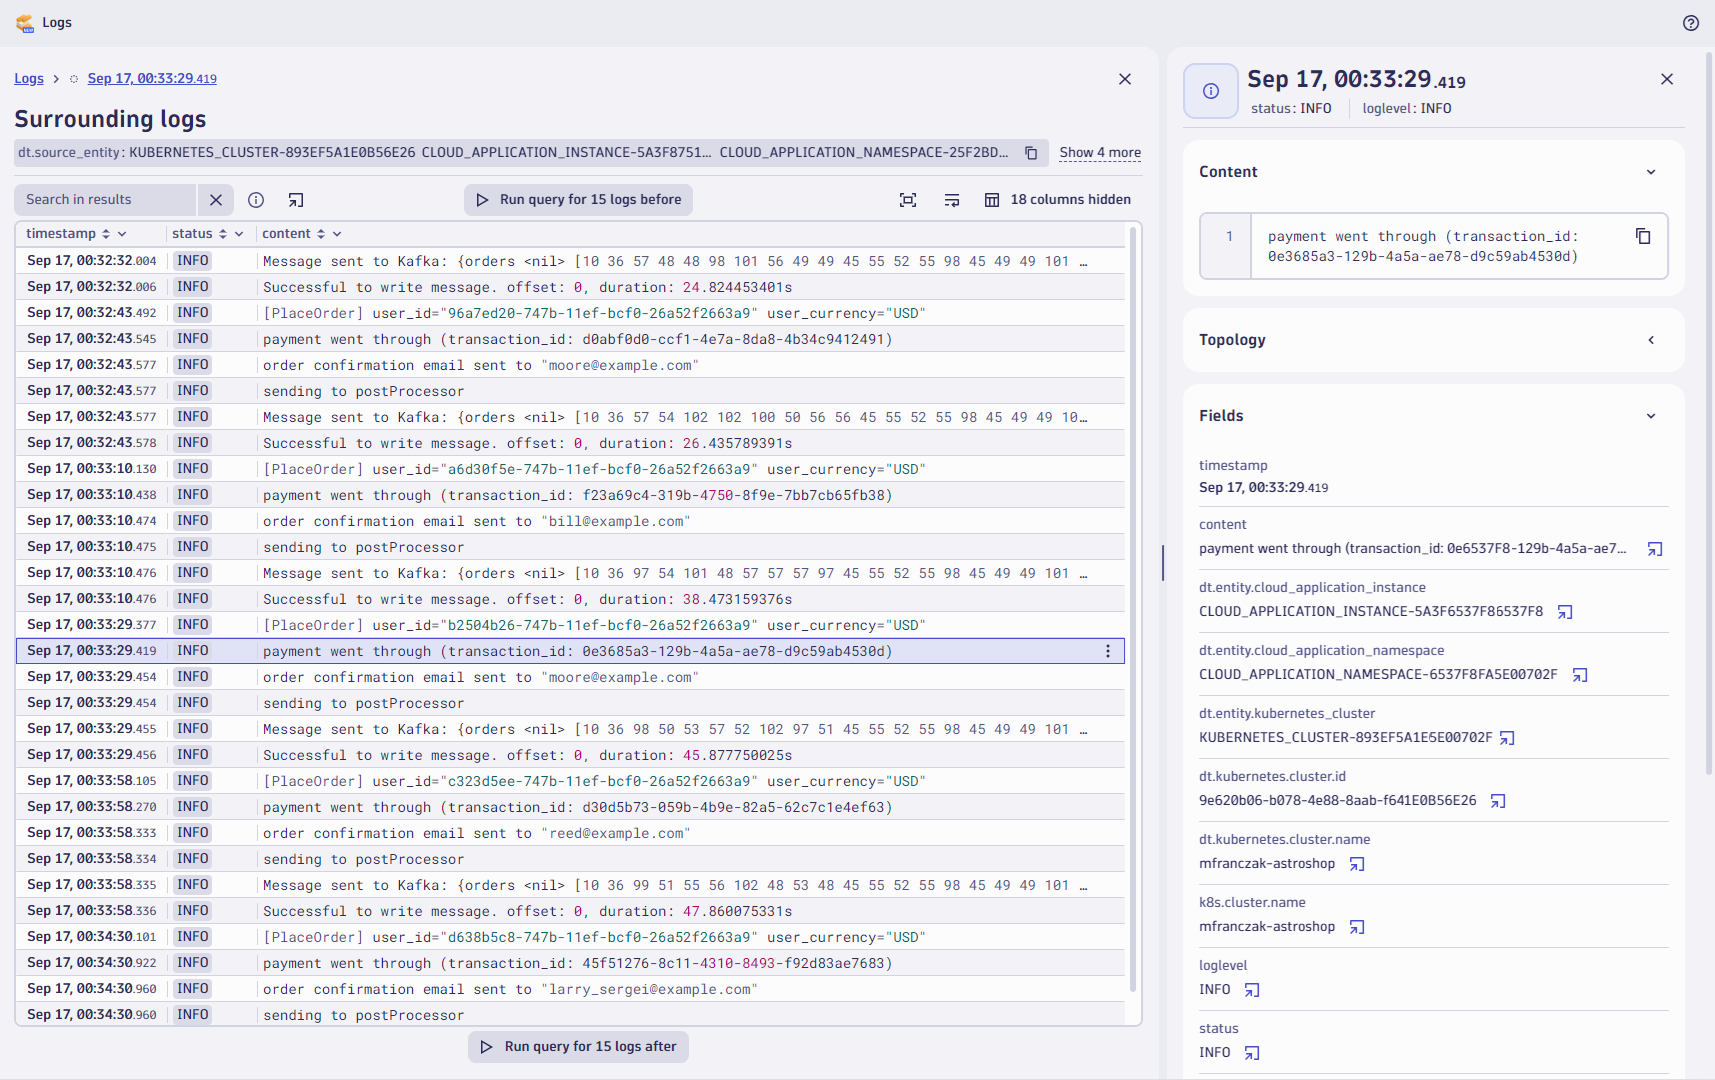 Figure 3. You can filter surrounding logs from within the Logs app, or by an open-with call from another app (for example, the Kubernetes app shown in Figure 2).
Simplicity for novice and power users
For users who seek quick access to relevant logs without the need to write complex queries, easy filtering capabilities are available from within individual log line details or by adding and selecting fields in the menu bar.
For those who aspire to become power users, the new in-app DQL editor (Dynatrace Query Language) translates manually selected filters into the DQL code executed in the backend.
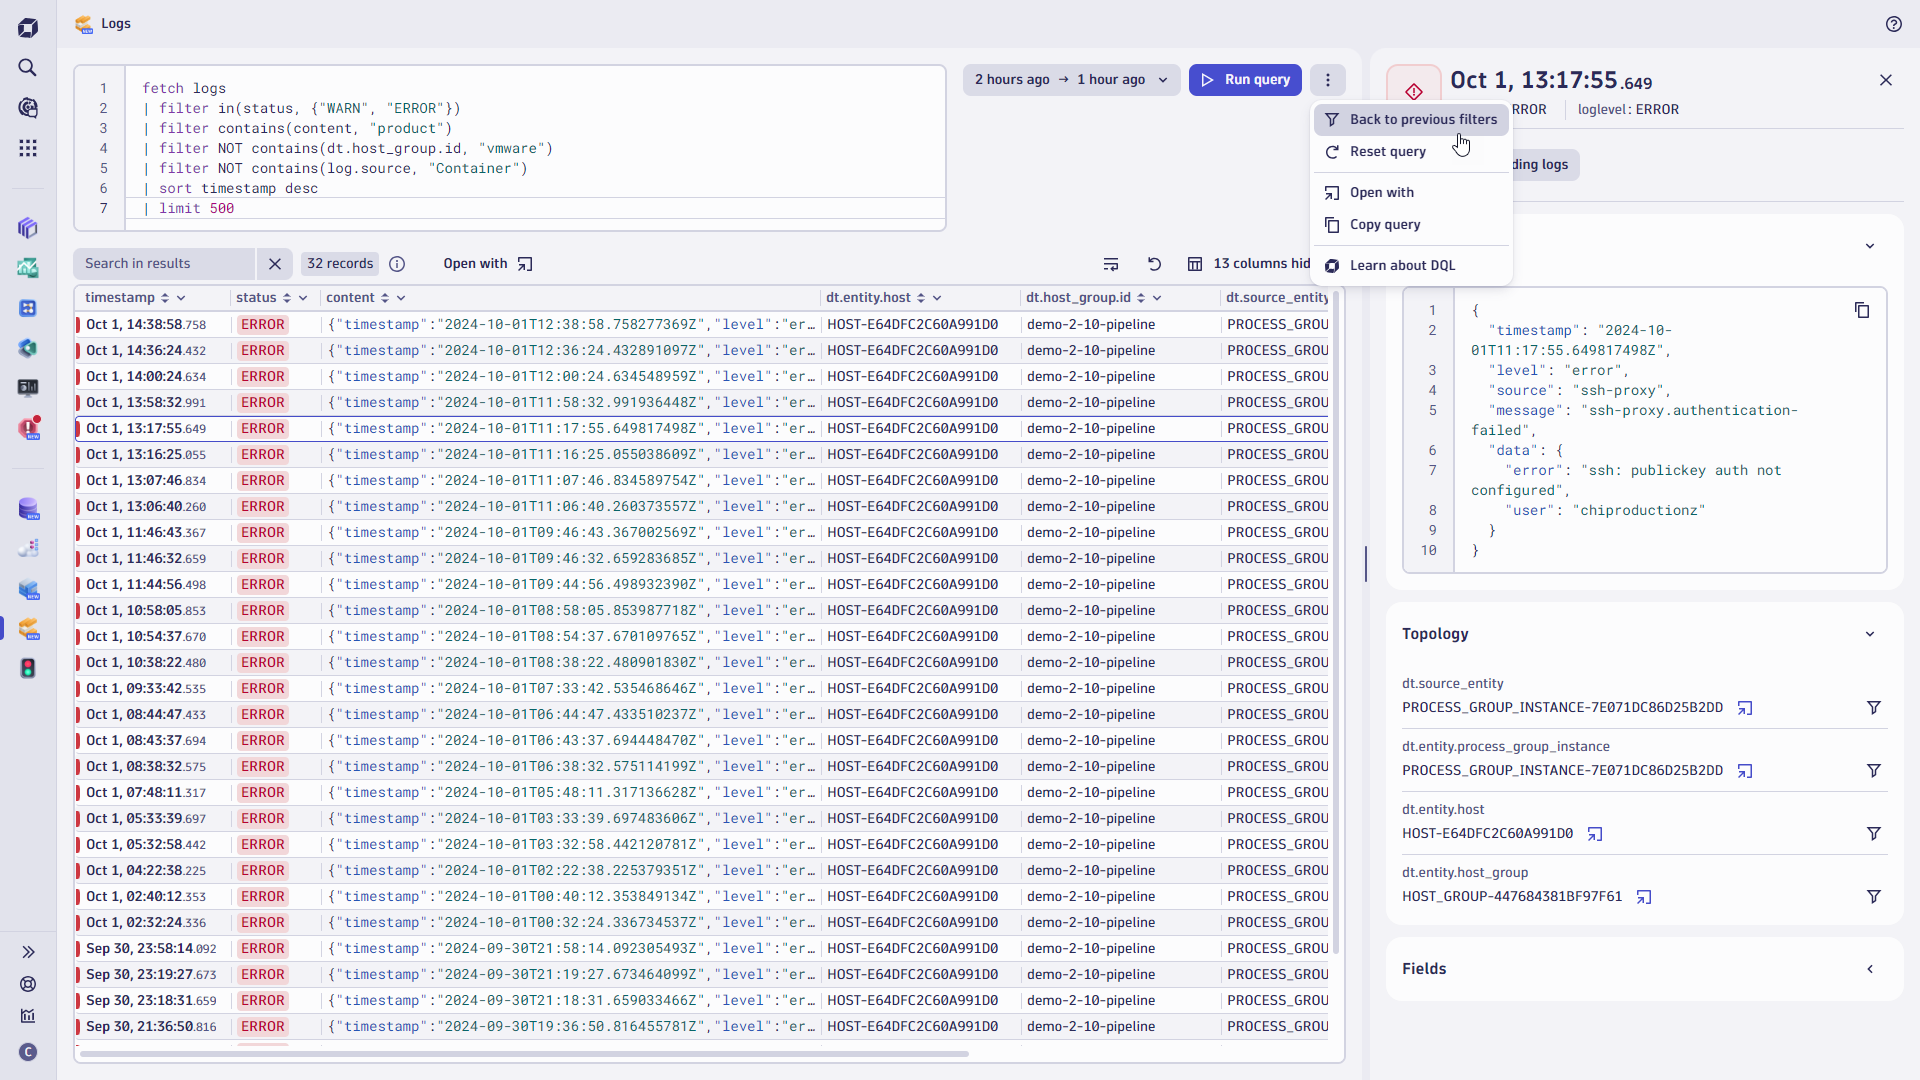 Figure 4. Logs app in advanced DQL-editor view, showcasing the capability to add additional filter conditions.
Power users can edit and enhance DQL queries to update results, or they can start directly within the DQL editor view. This allows deep-dive analysis when manual investigation or complex queries are required.
As the screenshot above shows, you can transition back to the filter selection menu bar by selecting Back to previous filters or by sharing the query and results with other teams.
This ensures a smooth user experience for DevOps engineers and SREs, whether they prefer intuitive click-and-filter workflows or fine-grained control through DQL.

Figure 5. Video of a Dynatrace user reviewing individual log lines, leveraging automatic log correlation of surrounding logs, and viewing details of additionally surfaced log entries.
Shortening time to value and increasing impact
With the general availability (GA) of the Logs app, another enhancement was introduced that shortens the time to value and increases the positive impact made within organizations.
Filtered log views that were customized by click-to-filter or by leveraging the DQL editor can now be shared using direct links—simply copy and paste the link displayed in your browser’s address bar.
This enables you to
- bookmark and share reoccurring or complex queries.
- share situation or incident-specific views across teams.
- provision new Dynatrace users with relevant queries
- share timeframe-specific and pre-filtered views in a support case
See more with less
During the preview release of the Logs app, many customers provided us with valuable feedback that we incorporated into the design of the app.
User requests, such as the newly added line wrap feature, increase the readability of results and eliminate the extra clicks required to open a detail view or load the results within a notebook. This shortens the time it takes to investigate results and take action.
Speaking of doing more with less, more was released simultaneously with the GA of the Logs app:
- Increased performance of query results returning
- Live search within query results
- Live sorting within query results
- custom column arrangement
- enhanced open-with capabilities to open queries in other platform apps,
or natively within the Logs app (for example, with Notebooks)
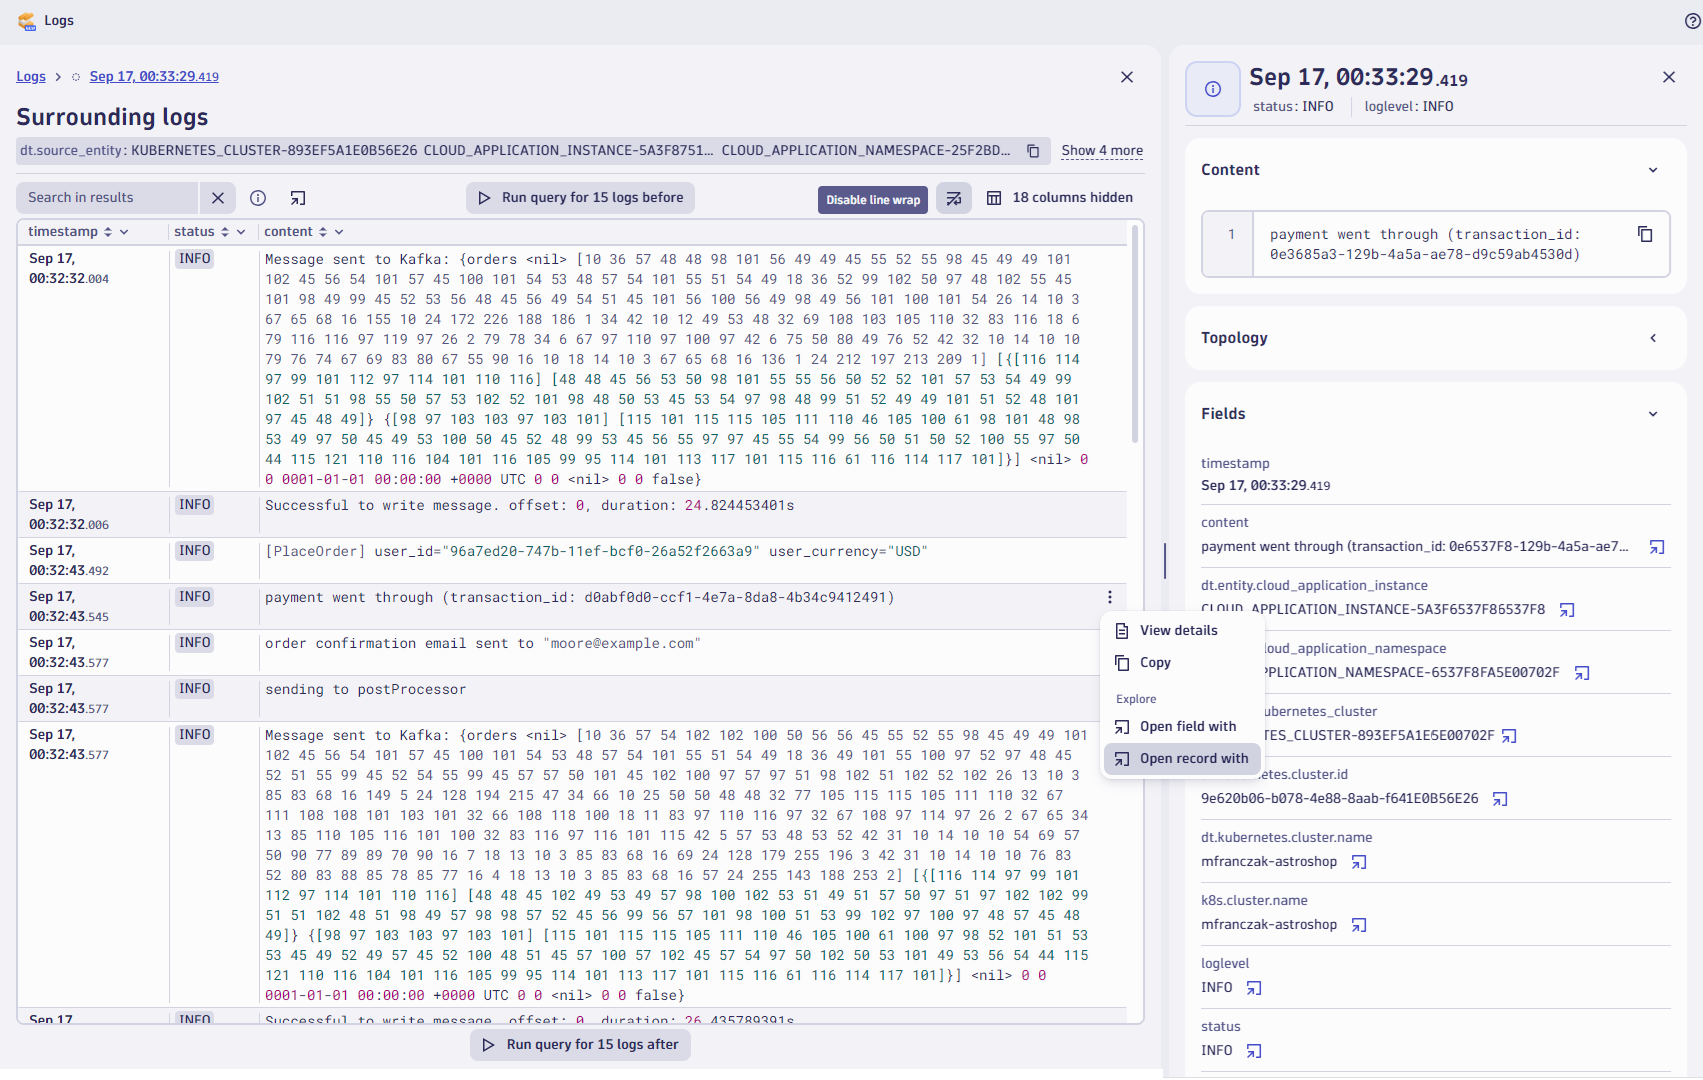 Figure 6. The open-with capabilities of the Logs app allow users to open single entries, such as individual host or node IDs in other apps, and to load the records in other applications like Notebooks or Dashboards.
Why Dynatrace
The Dynatrace advantage lies in its ability to set logs in direct context, either automated by Davis® AI, in the context of specific team needs within an application, or as part of the broader observability scope provided by the Logs app itself.
Only Dynatrace provides a comprehensive and accessible log management and analytics experience, helping teams resolve issues faster without compromising on depth. Only Dynatrace Grail is schema-on-read and indexless, built with scaling in mind and built for exabyte scale, leveraging massively parallel processing. With Dynatrace, there is no need to think about schema and indexes, re-hydration, or hot/cold storage concepts.
This architecture also means you’re not required to determine your log data use cases beforehand or while analyzing logs within the new Logs app.
This includes logs collected from your organization’s Hypervisors, Linux and Windows servers, cloud-native logs from Azure, AWS, GCP, or Oracle, alongside the networking signals from Cisco, Juniper, NetScaler, or F5 appliances—to name a few examples.
What’s next
It’s simple, fast, and easy to ingest and gain multi-purpose value from logs—all without the need to be an expert or learn a complex query language first.
Learn how Dynatrace can address your specific needs with a custom live demo. Our observability experts will walk you through our solutions and show you how to deliver excellent customer experiences, foster your application security, and simplify IT operations.
If you’re not yet a Dynatrace customer, start your 15-day free trial.
If you want to learn more about Dynatrace and Logs in context, join us for a demo.
 3 months ago
26