Introduction
This post discusses Amazon Elastic Container Service (Amazon ECS) Service Connect, a capability that provides a secure and scalable way to connect different Amazon ECS service deployments. This enables seamless communication between micro-services while reducing the operational overhead. It provides features such as service discovery, load balancing, and network traffic metrics.
This post primarily aims to outline a proactive approach to scaling Amazon ECS services by using custom metrics. These metrics are readily accessible by enabling the ECS Service Connect feature, thereby minimizing manual intervention and overhead.
Background
Traditional monolithic architectures are hard to scale and complex to maintain, thus limiting innovation. On the other hand, microservices architectures provide an approach where software is composed of small independent services that communicate over well-defined APIs, enabling rapid innovation. Applications that use a microservices architecture design have two key tenets: being independently scalable and loosely coupled. This makes them intrinsically distributed systems.
AWS has integrated building blocks to support distributed systems of any scale. When using Containers as fundamental building blocks of architecture, Amazon ECS offers powerful simplicity to build and operate resilient distributed applications. During the modernization process, users encounter a need for configuring application networking to achieve service-to-service communication, without adding additional infrastructure costs or complexity.
Amazon ECS Service Connect is an integrated capability that provides seamless service-to-service communication for applications deployed across multiple Amazon ECS clusters and virtual private clouds (Amazon VPC). This is done without needing to provision additional infrastructure such as load balancers. It does this by building both service discovery and a service mesh in Amazon ECS. With Amazon ECS Service Connect, you can refer and connect to your services by logical names using a namespace provided by AWS Cloud Map and automatically distribute traffic between Amazon ECS tasks without deploying and configuring load balancers. When you create or update an Amazon ECS service with a Service Connect configuration, a proxy sidecar container is added to each new task. For service-to-service communication within the same namespace, the proxy acts as a connecting layer providing features such as round-robin load balancing, outlier detection, retries, and connection timeouts. Service Connect also provides a layer of resilience by providing real-time network traffic metrics with no changes to your application code, in which you can monitor your application’s health and from which the outlier detection uses to stop routing requests to failing endpoints.
Horizontal scalability is a critical aspect of cloud native applications. By default, Amazon ECS publishes Amazon CloudWatch metrics with the service’s average CPU and memory usage for Service auto scaling to increase or decrease the number of tasks within a service. When Service Connect is configured, as it supports HTTP/1, HTTP/2, gRPC, and TCP protocols, it adds two new Metric Dimensions: DiscoveryName and TargetDiscoveryName. These contain additional metrics that span from load monitoring to error tracking, such as:
- RequestCount
- ProcessedBytes
- ActiveConnectionCount
- NewConnectionCount
- HTTPCode_Target_2XX_Count
- ClientTLSNegotiationErrorCount
- TargetResponseTime
A more exhaustive list can be found in the Amazon ECS Metrics documentation.
There are several use cases where pre-defined metrics on their own are not reliable indicators of when to execute a scaling action and by how much. In certain scenarios, custom metrics that track other application aspects such as the number of HTTP requests processed by the Service Connect proxy, or target response time, may be better suited to trigger scaling actions. In this post, we outline an approach that provides a viable path to proactively scale Amazon ECS services using a load monitoring metric such as RequestCount provided by Amazon ECS Service Connect proxy.
Solution overview
We demonstrate how Amazon ECS services can be proactively scaled by using a sample Yelb application (app) hosted on GitHub. This is a three tier application, which uses an external load balancer for end-users connecting to the web-tier yelb-ui service and Amazon ECS Service Connect between yelb-appserver, yelb-redis and yelb-db for service-to-service communication. The services with Amazon ECS Service Connect enabled also have Amazon ECS Service Connect Agent deployed. The architectural diagram shown here outlines the components and layers of the three-tier application that we discussed.
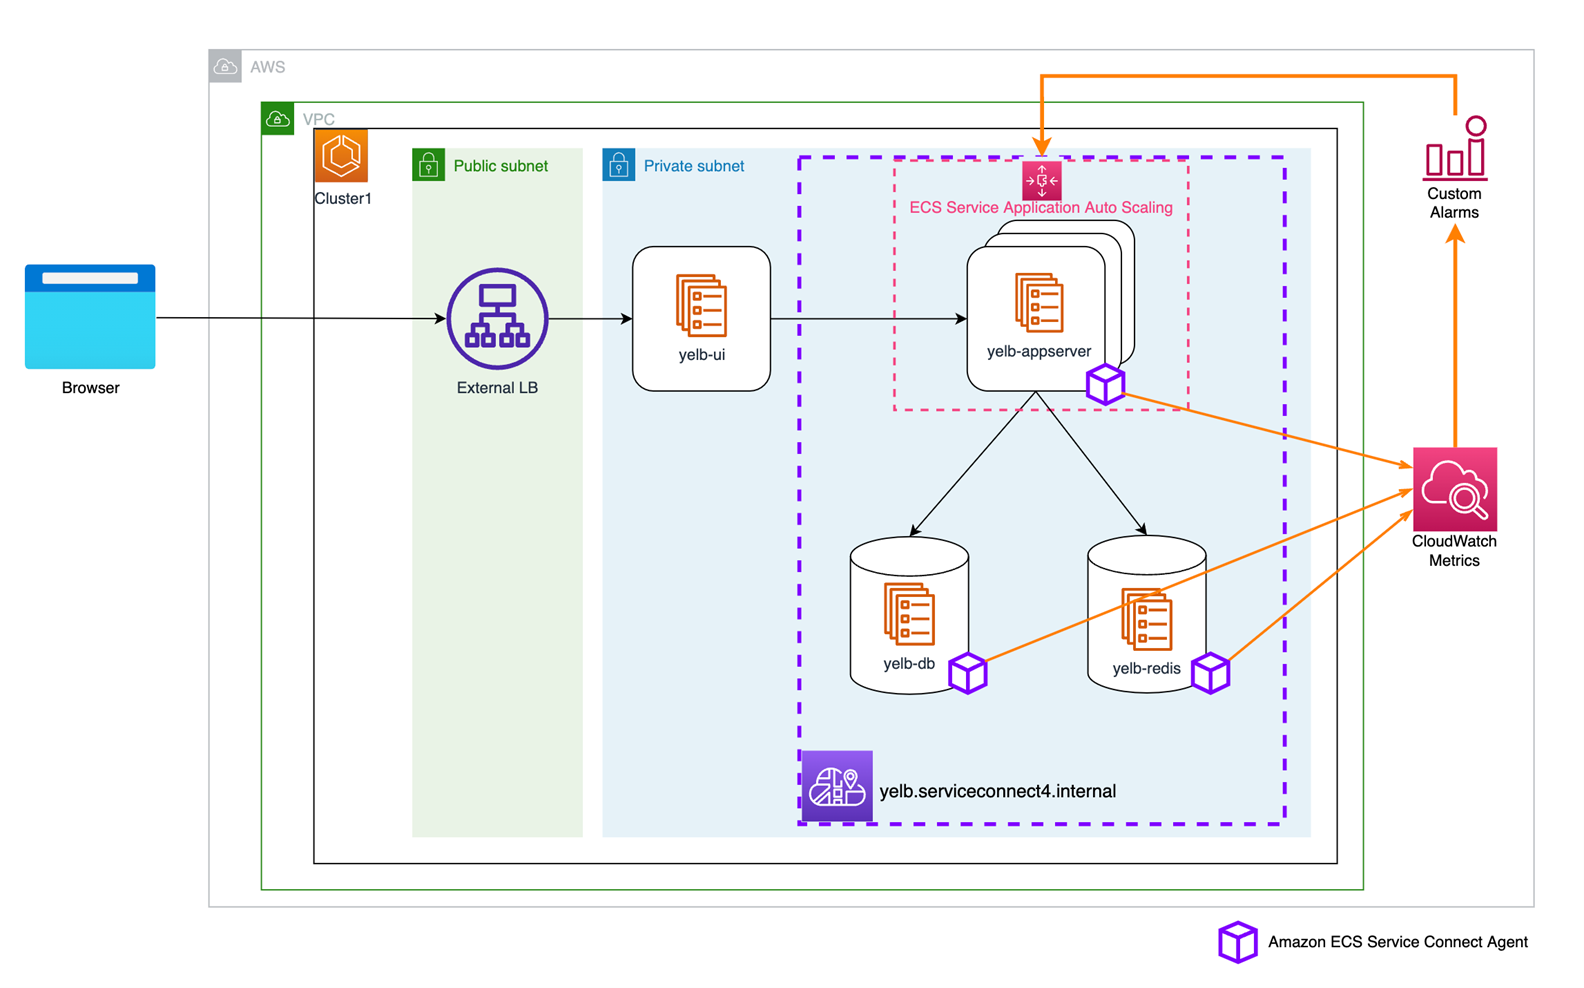
Figure 1: Architecture diagram showing three-tier applications, and the services enabled with Amazon ECS Service Connect
Prerequisites
For this walkthrough, you need the following prerequisites:
- An AWS Account
- Access to a shell environment. This can be a shell running in an AWS Cloud9 Instance, AWS CloudShell, or locally on your system.
- Your shell environment needs to have git installed and the AWS Command Line Interface (AWS CLI) configured with version 2.9.2 or higher.
- Your AWS CLI needs to have a profile configured with access to the AWS account you wish to use for this walkthrough.
Walkthrough
At a high level we are going through the following process:
- Set up the necessary infrastructure for an Amazon ECS Cluster and deploy the sample Yelb Application.
- Review and configure the Service Connect metrics on the Amazon ECS console and CloudWatch.
- Simulate high traffic to the yelb-appserver service by running a load generator script.
- Configure an Alarm based on Service Connect metrics to make sure that each task of the yelb-appserver processes no more than an average of 150 requests.
- Validate Service Auto Scaling based on the RequestCount metric.
Step 1: Initial setup
Download the sample code to the computer or shell environment you are using for this walkthrough. If you have not yet done so, run the following command to clone a copy of the provided GitHub Repo to your system from your terminal.
To simplify the setup experience, you use an AWS CloudFormation template to provision the necessary infrastructure, service, and task definitions needed for this walkthrough. Run the simple setup script from the shell environment of your choice to deploy the provided CloudFormation template after you initialize the following variables:
You can find a comprehensive list of the resources deployed in this Amazon Containers post.
Note that the setup script takes around five minutes to complete, and first availability of the CloudWatch metrics might take up to 15 minutes.
Step 2: Explore and configure the Service Connect metrics in CloudWatch
With the infrastructure in place and the Yelb application deployed, you can explore the newly published metrics by following these steps:
- Navigate to the CloudWatch console, under Metrics select All metrics and choose ECS.
- Choose the metric dimensions ClusterName, DiscoveryName, and ServiceName.
- Under the DiscoveryName, locate one of the backend services (such as yelb-appserver) to view key application telemetry metrics, such as RequestCount and NewConnectionCount, published by the Amazon ECS Service Connect Proxy.
- Upon selecting these metrics using the check box, navigate to the Graphed Metrics tab and adjust the Period to 1 minute granularity to display more detailed information on the graph. Metrics are aggregated according to the configuration of this period and used for taking actions or setting alarms for our Amazon ECS Service.
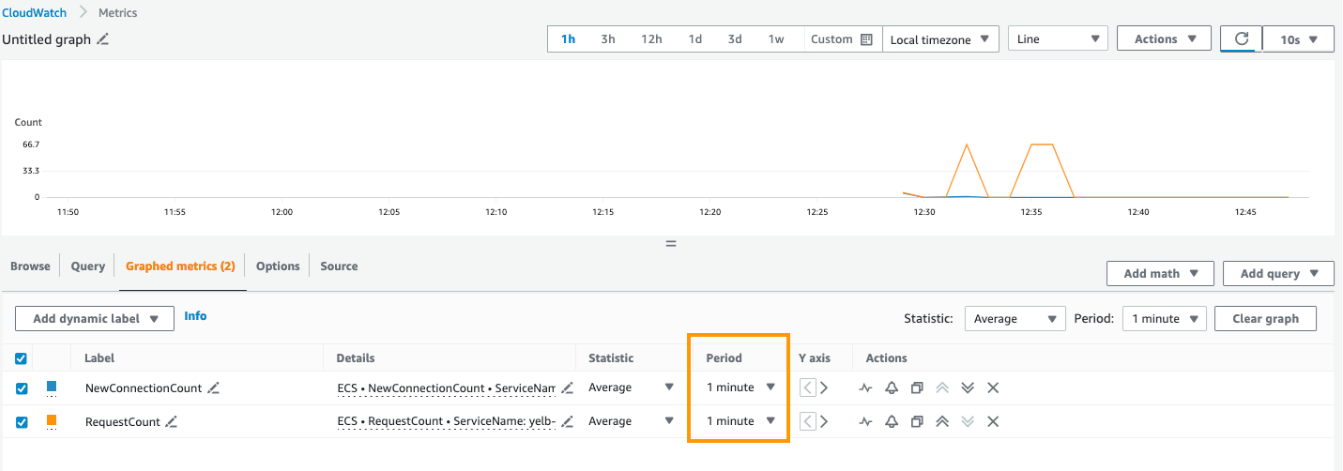
Figure 2: Diagram showing the chosen metrics along with the desired granularity
Step 3: Traffic simulation for threshold identification
Determining the average number of requests that an application can handle is essential to fine tune the threshold for Amazon CloudWatch Alarm. For the yelb-appserver service, we need to identify threshold that can be used for creating a CloudWatch alarm based on which Service Autoscaling is configured.
- To simulate user traffic and identify a high threshold for Service Autoscaling, we execute a for loop designed to perform 40,000 HTTP requests targeting our application’s backend yelb-appserver.
This method assists us in determining the average number of requests that our yelb-appserver can handle.
The /api/getvotes path initiates a call from the yelb-ui service to the yelb-appserver service. This process starts with the client-only Amazon ECS Service Connect Proxy within yelb-ui and progresses to the yelb-appserver client-server Amazon ECS Service Connect proxy. This ultimately registers and publishes the RequestCount metric. After a few minutes you should see data points published, with RequestCount pointing an average of about 180 to 200 requests per minute, on a per service basis.

Figure 3: CloudWatch console showing RequestCount reflecting the incoming traffic simulation
Note that alternatively you can also fine tune the requests on a per-task basis. To do so, you can use the RequestCountPerTarget metric instead, available within the TargetDiscoveryName dimension.
Step 4: Create and configure an alarm based on Service Connect metrics
For the graphed metric RequestCount of the yelb-appserver service, we can now create a CloudWatch alarm based on static threshold with a condition specifying a threshold value of 150 or greater.
To do this, follow the next steps:
- Navigate to the CloudWatch console.
- Under Metrics select All metrics and choose ECS.
- Choose the metric dimension ClusterName, DiscoveryName, ServiceName.
- Search for yelb-appserver under DiscoveryName and choose the metric RequestCount.
- Select Create Alarm.
- Specify the threshold value (150 in this example).
- Specify the threshold value (150 in this example)
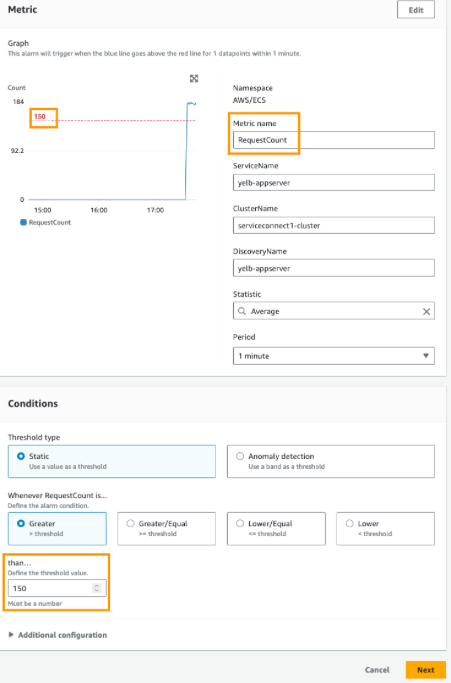
Figure 4: Alarm configuration, setting the metric name and threshold
Note that threshold values vary according to application behavior. Load testing specific to your application should be conducted to determine the number of requests that each task can handle with a specific CPU and Memory configuration. In this scenario, we are assuming 150 as the RequestCount threshold, as Step 2 identified the range of 180-200 as the average request count.
Optionally, you can also configure alarm change notifications to be sent to an Amazon Simple Notification Service (SNS) topic, as can be seen in the following steps:
- After configuring the alarm as seen previously and selecting the Next button, you should now see the Configure Actions page.
- For the desired Alarm state trigger, you can either select an existing SNS topic or create a new topic
- If you opted to create a new SNS topic, you are asked to provide an email address destination to receive the notifications
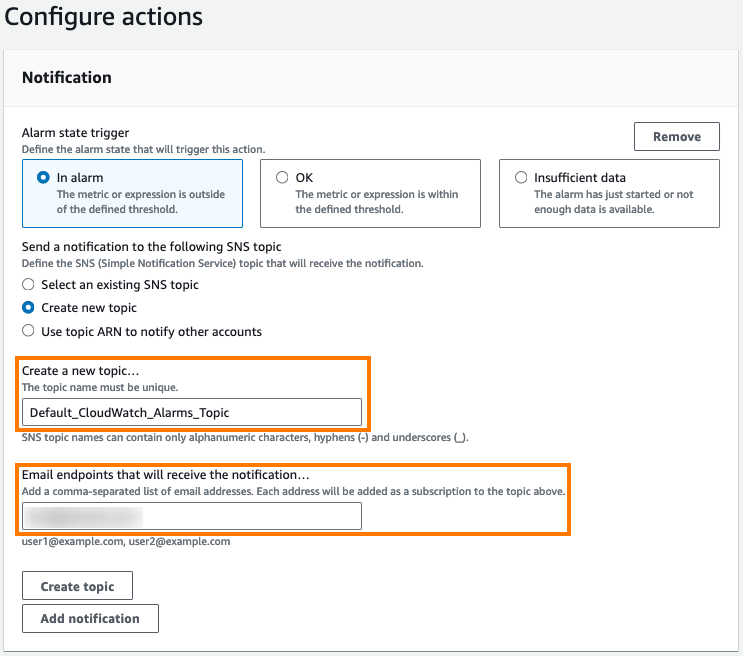
Figure 5: Alarm configuration – opting for email notification by subscribing to a specific topic
- Upon configuring notifications and selecting next, you can name the alarm, for example, yelb-web-server-request-high, and create the alarm.
- You should also receive an email confirming the SNS subscription for the topic that you just created.

Figure 6: Email notification, for confirming subscription to the specified SNS topic
After a few minutes, you should see that the alarm is triggered and marked as the “In Alarm” state. This is because the load testing incurred an average request count of 180, which is already higher than the threshold of 150 that is configured.

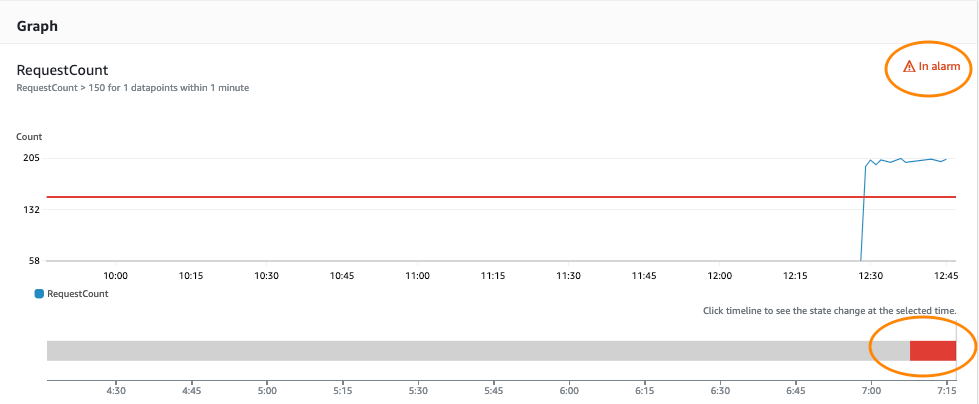
Figure 7: CloudWatch console triggering an alert due to the number of requests exceeding the established threshold limit
We now configure our yelb-appserver service in the Amazon ECS cluster to scale tasks based on this breached alarm.
Step 5: Configure Service autoscaling based on the RequestCount metric
Before configuring service autoscaling, you can check the current number of tasks running within the yelb-appserver service by navigating to serviceconnect1-cluster within the Amazon ECS console. The example is set to create three tasks within the yelb-appserver service as per the service definition.

Figure 8: Initial number of tasks that are part of the yelb-appserver service, as configured during the deployment
- Service autoscaling can increase or decrease the number of tasks that your service runs based on a set of scaling adjustments, known as step adjustments, which vary based on the size of the alarm breach. To configure the same, navigate to the yelb-appserver service and select Update Service.
- Select Service auto scaling and select Use service auto scaling to configure the appropriate values.
- In this walkthrough, we create a service autoscaling configuration with a minimum of three tasks and a maximum of six tasks.
- For the scaling policy, you can select Step Scaling and name the yelb-appserver-scaleup-policy.
- As a final step, you can select the CloudWatch Alarm yelb-webserver-request-high created in Step 4. Then, you can apply adjustments to increase the number of tasks by one when the alarm breaches threshold and select Update to update the service.
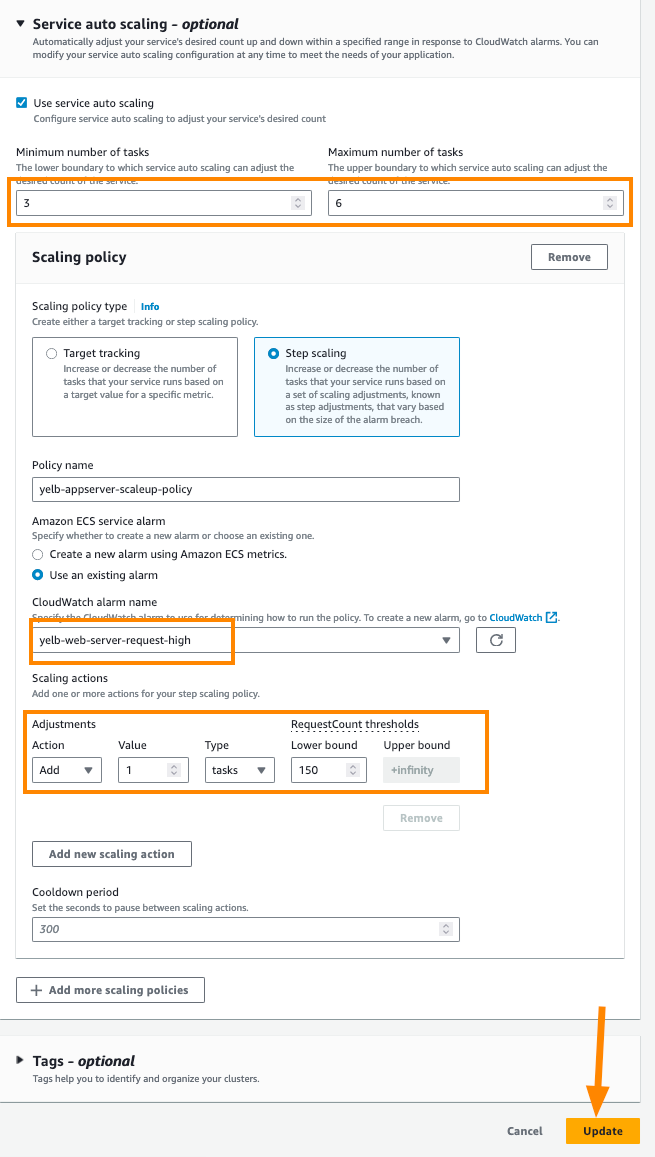
Figure 9: Configuring the autoscaling policy for the yelb-appserver based on the yelb-web-server-request-high alarm
As service autoscaling is configured and the alarm has breached the threshold, you can see Amazon ECS tries to scale up the application by setting the desired count of the service to four.

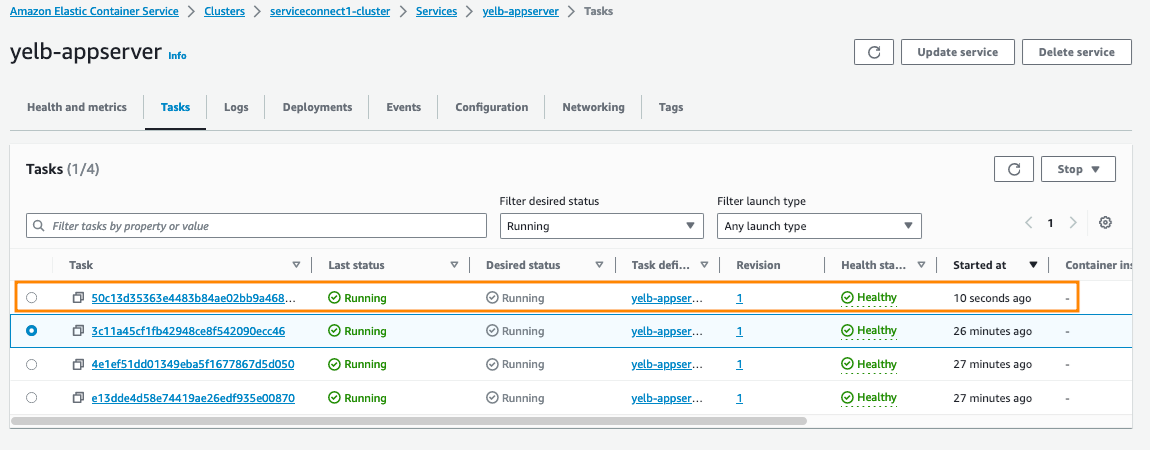
Figure 10: New task being spun up, based on the configured autoscaling policy
Upon scaling up the service to four tasks, we can see that the average RequestCount has been reduced to about 130. This is below the threshold configured, and as a result the alarm status changed to green (OK).
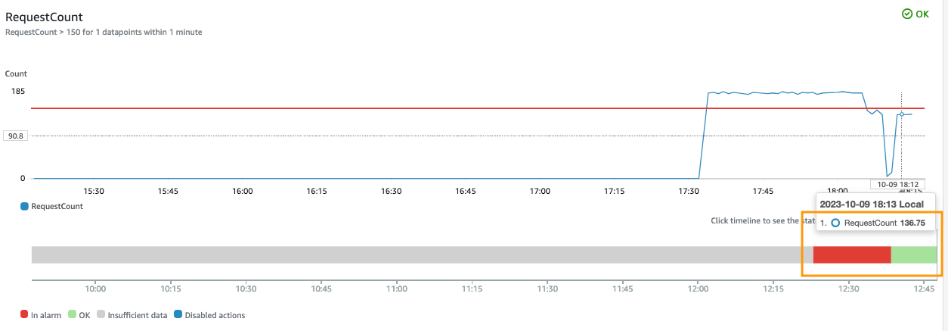
Figure 11: Average RequestCount dropping below the threshold value, as a result of autoscaling
Cleaning up
To avoid future charges, clean up the resources created in this post. To make it easier, we created a ./scripts/cleanup.sh script for you to use.
Run the following command:
Note that the cleanup script takes around 20–25 minutes to complete
Conclusion
With this walkthrough, you can implement the solution to proactively scale Amazon ECS services using Service Connect metrics such as RequestCount. To learn more about Amazon ECS Service Connect, check out the Amazon ECS Service Connect: Simplified interservice communication session from re:Invent 2022 and the Amazon ECS Service Connect documentation.
 8 months ago
41