 1 month ago
15
1 month ago
15
As more organizations embrace DevOps and CI/CD pipelines, GitHub-hosted runners and GitHub Actions have emerged as powerful tools for automating workflows. But as with many other automation tools, it can be difficult to maintain the performance and visibility of these workflows. That’s where Dynatrace business events and automation workflows come into play to provide a comprehensive view of your CI/CD pipelines.
Let’s explore some of the advantages of monitoring GitHub runners using Dynatrace.
- Enhanced observability and release validation
Dynatrace already excels at delivering full-stack, end-to-end observability of your systems and user journeys. Extending this visibility into your CI/CD pipelines offers even greater value. By integrating Dynatrace with GitHub Actions, you can proactively monitor for potential issues or slowdowns in the deployment processes. You can also validate releases to ensure quality and reliability. With this integration, teams can detect, confirm, and resolve problems faster by correlating new issues directly to updates deployed by a GitHub runner, streamlining troubleshooting, and minimizing downtime. - Improving collaboration across teams
By surfacing actionable insights and centralized monitoring data, Dynatrace fosters collaboration between development, operations, security, and business teams. Everyone involved in the software delivery lifecycle can work together more effectively with a single source of truth and a shared understanding of pipeline performance and health. - Optimizing resource utilization
Whether you’re using self-hosted or GitHub-hosted runners, their resource demands can significantly impact your organization. Inefficient or resource-intensive runners can lead to increased costs and underutilized infrastructure. With Dynatrace, you can monitor runner resource usage and consumption patterns, identify inefficiencies, and optimize runner performance. This awareness allows teams to allocate and scale resources more effectively, reducing costs while ensuring CI/CD pipelines operate smoothly and efficiently.
Automating GitHub runner data ingestion with Dynatrace workflows
Workflows within the Dynatrace SaaS platform are a robust tool for automating complex processes. In the example below, we demonstrate how to use workflows to ingest data from the GitHub API, capturing detailed information about runners and integrating it seamlessly into Dynatrace business events for actionable insights.
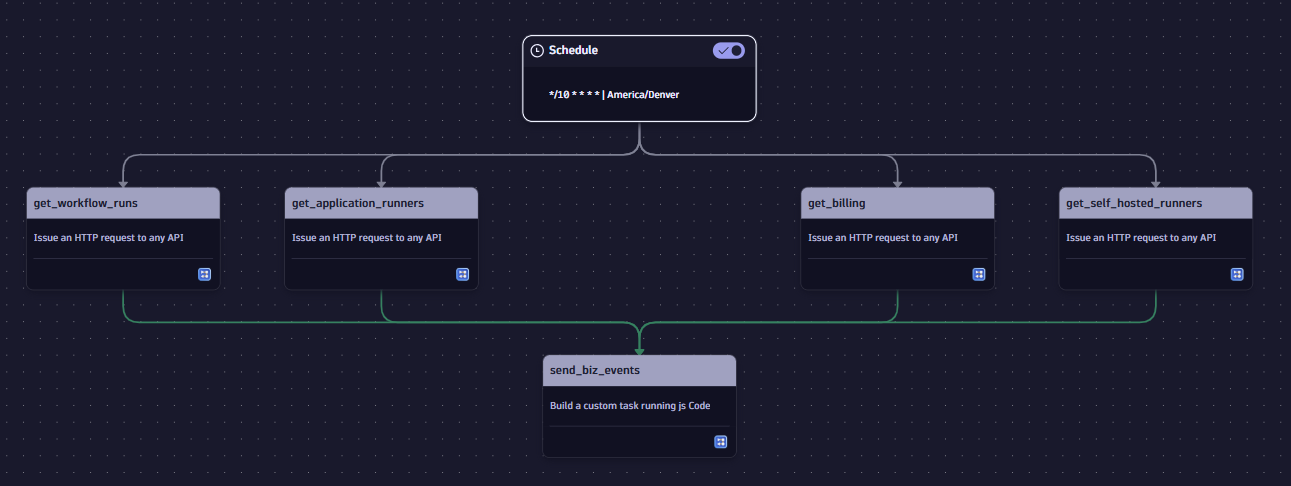
Workflow overview
The workflow, though simple, is highly effective. It begins with a timed trigger set to run every 10 minutes. After triggering, the workflow sends a series of GET requests to the following GitHub API endpoints:
- /actions/runs – Retrieves workflow run details.
- /actions/runners/downloads – Fetches runner software download information.
- /actions/runners – Provides details about self-hosted and GitHub-hosted runners.
- /billing/actions – Tracks the minutes consumed by GitHub-hosted runners.
This data covers all aspects of CI/CD activity, from workflow executions to runner performance and cost metrics.
In the final step of the workflow, a JavaScript processes the API responses. Since GitHub API endpoints return data in different formats, the script normalizes and cleans the data to ensure consistency. This customization ensures that only the relevant metrics are extracted, tailored to the user’s needs.
Once the data is formatted, it is ingested into Dynatrace Business Analytics using the Dynatrace SDK. This integration enables advanced analysis, visualization, and reporting on runner and workflow performance within the Dynatrace platform.
To simplify implementation, find the JavaScript and workflow templates on this GitHub repository.
Visualizing the data
Using Dynatrace dashboards and business events, you can visualize GitHub workflows, runners, and performance metrics in a centralized, customizable interface.
Example dashboard overview
In the example below, a straightforward dashboard visualizes key GitHub data:
Workflow runs and states: Displays the number of workflow executions and their current states (for example success, failure, in progress).
GitHub-hosted runner usage: Tracks the time spent on GitHub-hosted runners, helping monitor resource usage and associated costs.
Self-hosted runner status: Provides real-time insights into the health and performance of self-hosted runners.
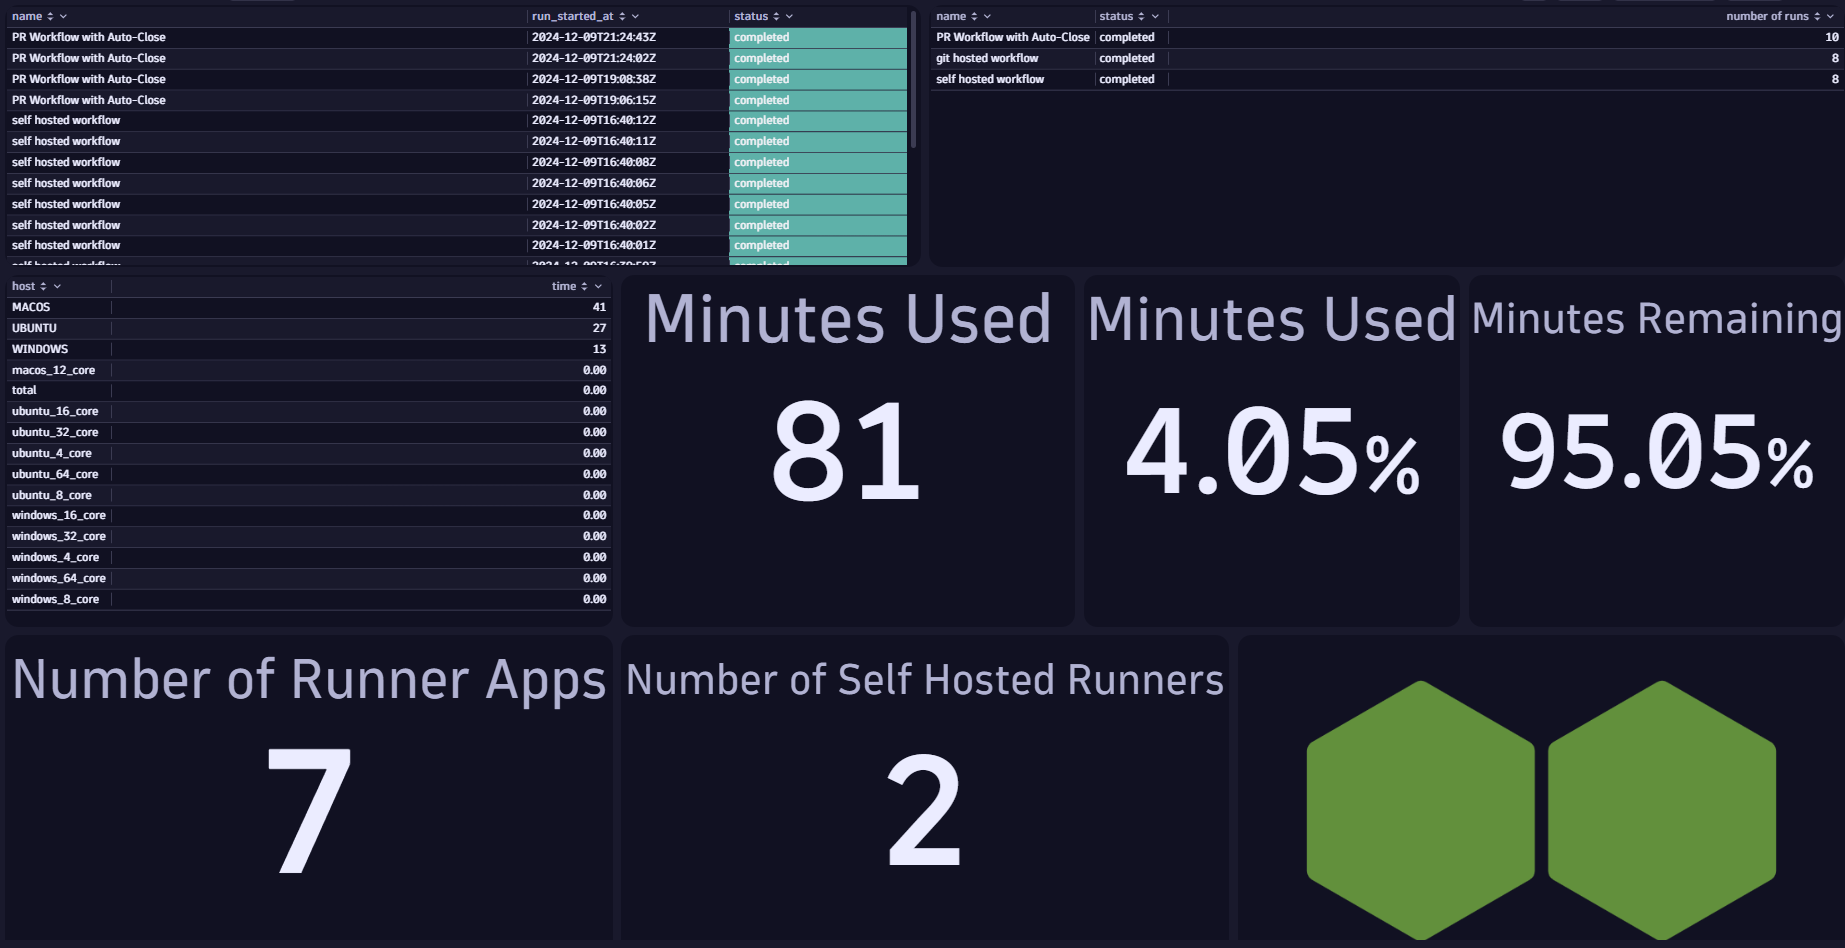
This view is fully customizable, allowing users to tailor it to the specific data ingested from their workflows using the Dynatrace Query Language (DQL).
Next steps: Unlock the potential of GitHub data in Dynatrace
The examples provided were designed to be straightforward and easy to implement, offering a foundation for integrating GitHub data into Dynatrace. However, these use cases are just the beginning. When your data is in Dynatrace, the possibilities for analysis and visualization are virtually limitless.
Here are some next steps to consider:
- Visualize workflow success trends
- Identify runner performance bottlenecks
- Correlate runner activity with workflow execution times
With the flexibility of DQL and Dynatrace’s powerful visualizations, you can create customized dashboards and reports that deliver actionable insights tailored to your needs. The only limit is your imagination—experiment with new queries, uncover hidden trends, and continually refine your monitoring setup to maximize the value of your GitHub data. To achieve all this and more, try Dynatrace in your own environment today.