With the move towards cloud-native computing, having a clear understanding of your Kubernetes platform’s performance and application behavior is a requirement. Having the ability to troubleshoot quickly and easily is especially important. Logging provides platform and application owners with an effective way to understand the state of their workloads by giving them a view into the inner workings of their systems. Log collection platforms, such as Fluent Bit, give organizations a much-needed solution for quickly gathering and processing log data to make it available in different backends for further analytics. This is especially necessary within complex cloud-native—and, more specifically, Kubernetes—environments.
Fluent Bit, an open source tool within the CNCF ecosystem, is a popular choice when choosing which log collection tool to use. At Dynatrace, we’re happy to make your life easier when leveraging logs for troubleshooting Kubernetes workloads by providing a ready-to-use integration with Fluent Bit. The integration ensures all logs are enriched properly to enable context-rich troubleshooting and allows you to connect the streamed logs with distributed traces and the Kubernetes domain model.
Speed up your troubleshooting processes
Log analysis is typically the first step in the troubleshooting process. Therefore, it’s critical that when an issue arises, you have the right data and tools to quickly and easily understand the full scope of what’s happening within your applications.
Dynatrace integration with Fluent Bit allows platform and development teams to examine Kubernetes logs in the context of their workloads and pods. For containers, they get the full context of individual traces throughout the hybrid microservices application stack.
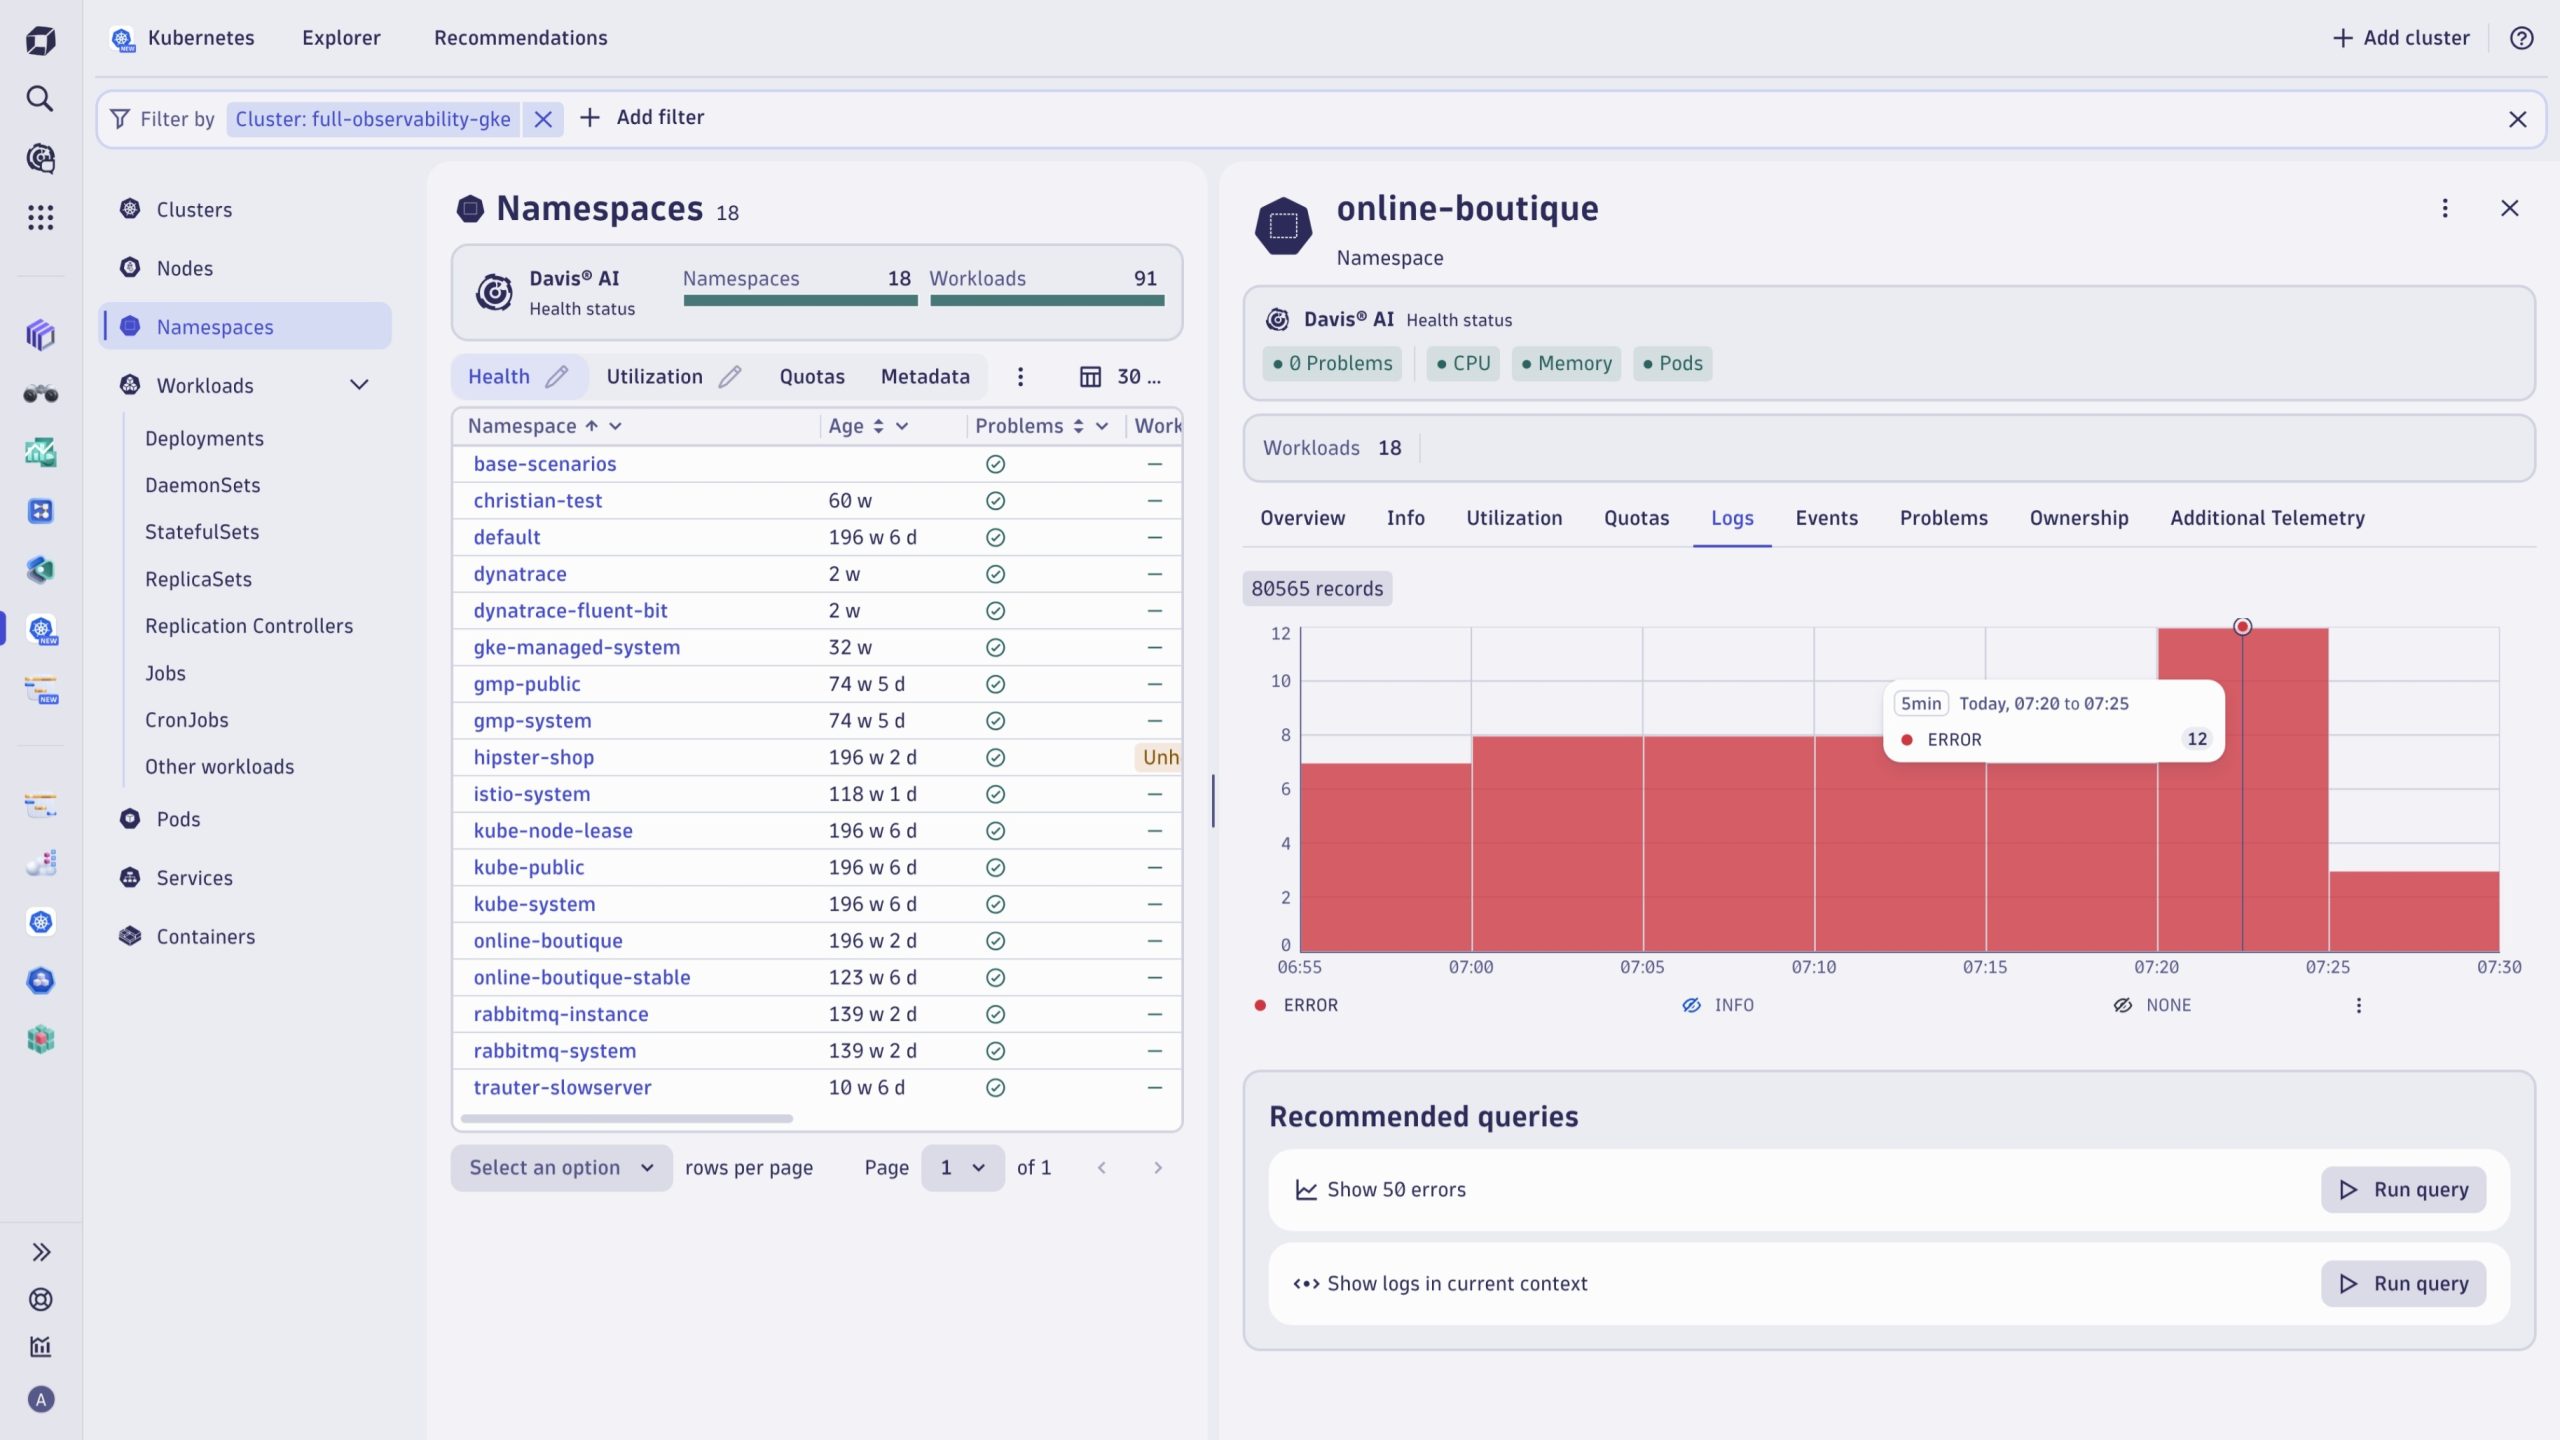
When your microservices have an issue, you can look into error logs within the Kubernetes app at the respective namespace or workload and search for erroneous log lines.

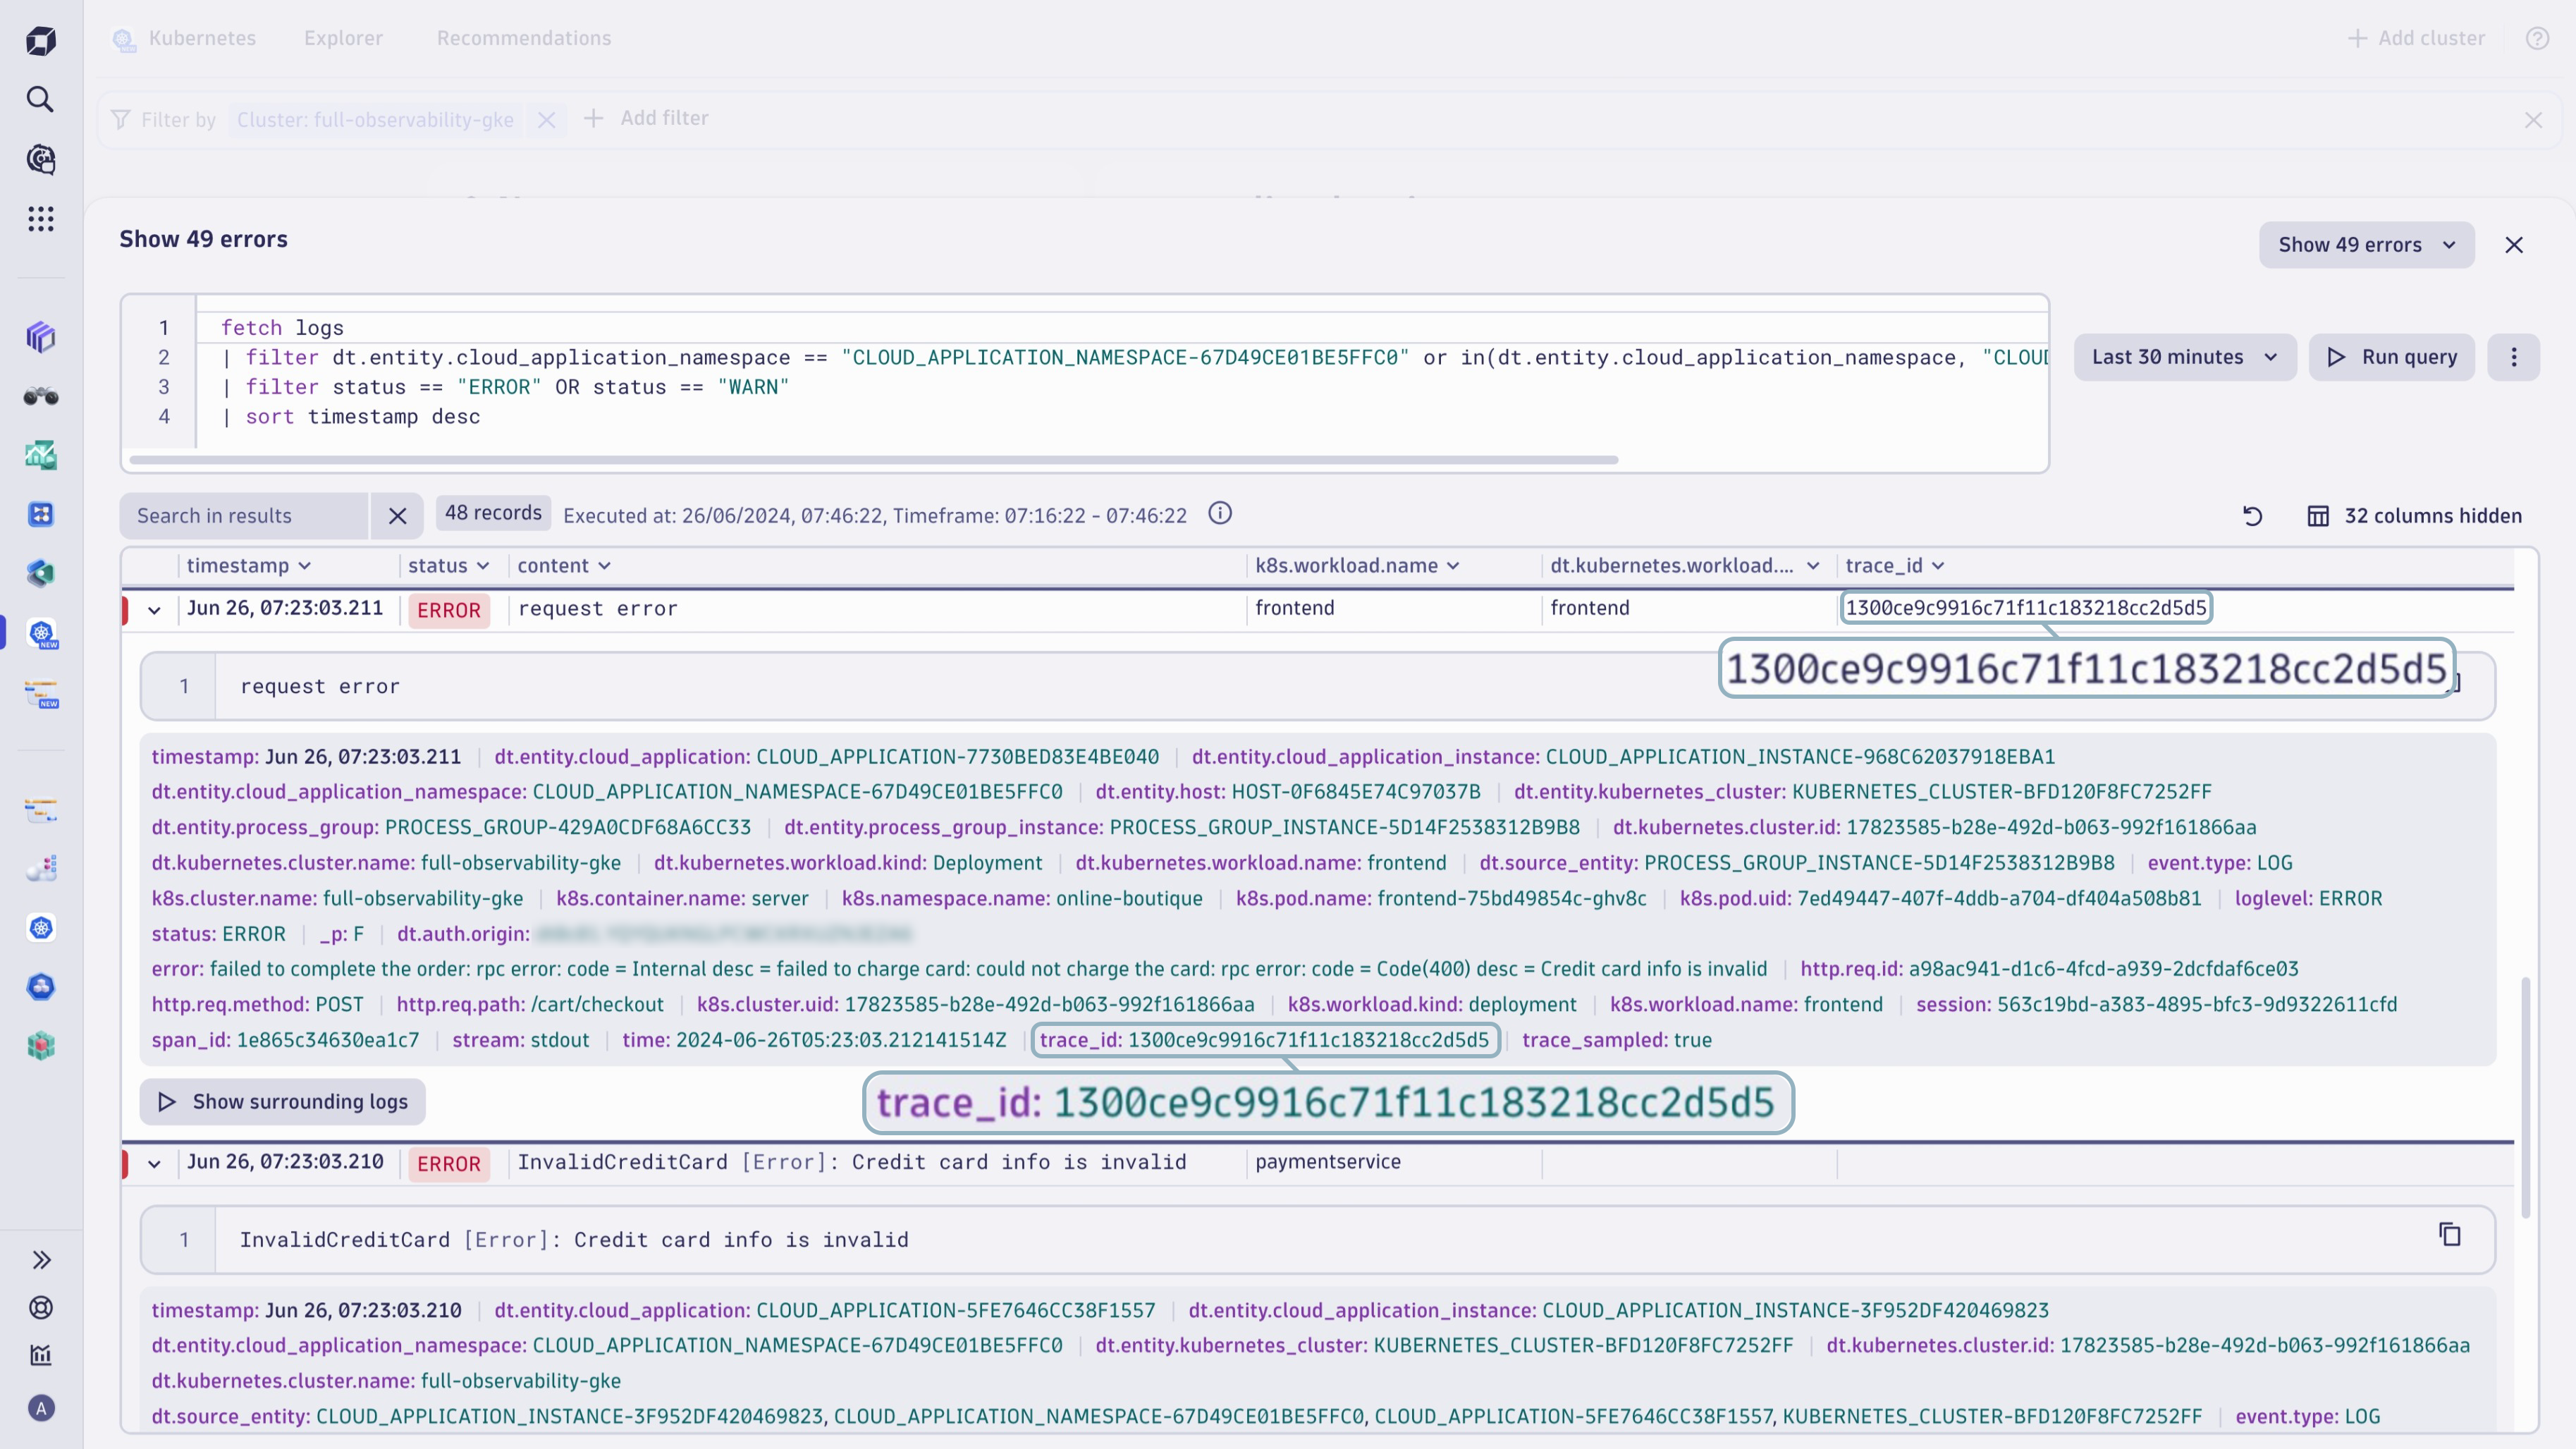
When using Dynatrace OneAgent® for automated distributed tracing of all your Kubernetes workloads, the logs are automatically enriched with tracing metadata. You get the complete picture of the logs of each workload or namespace.

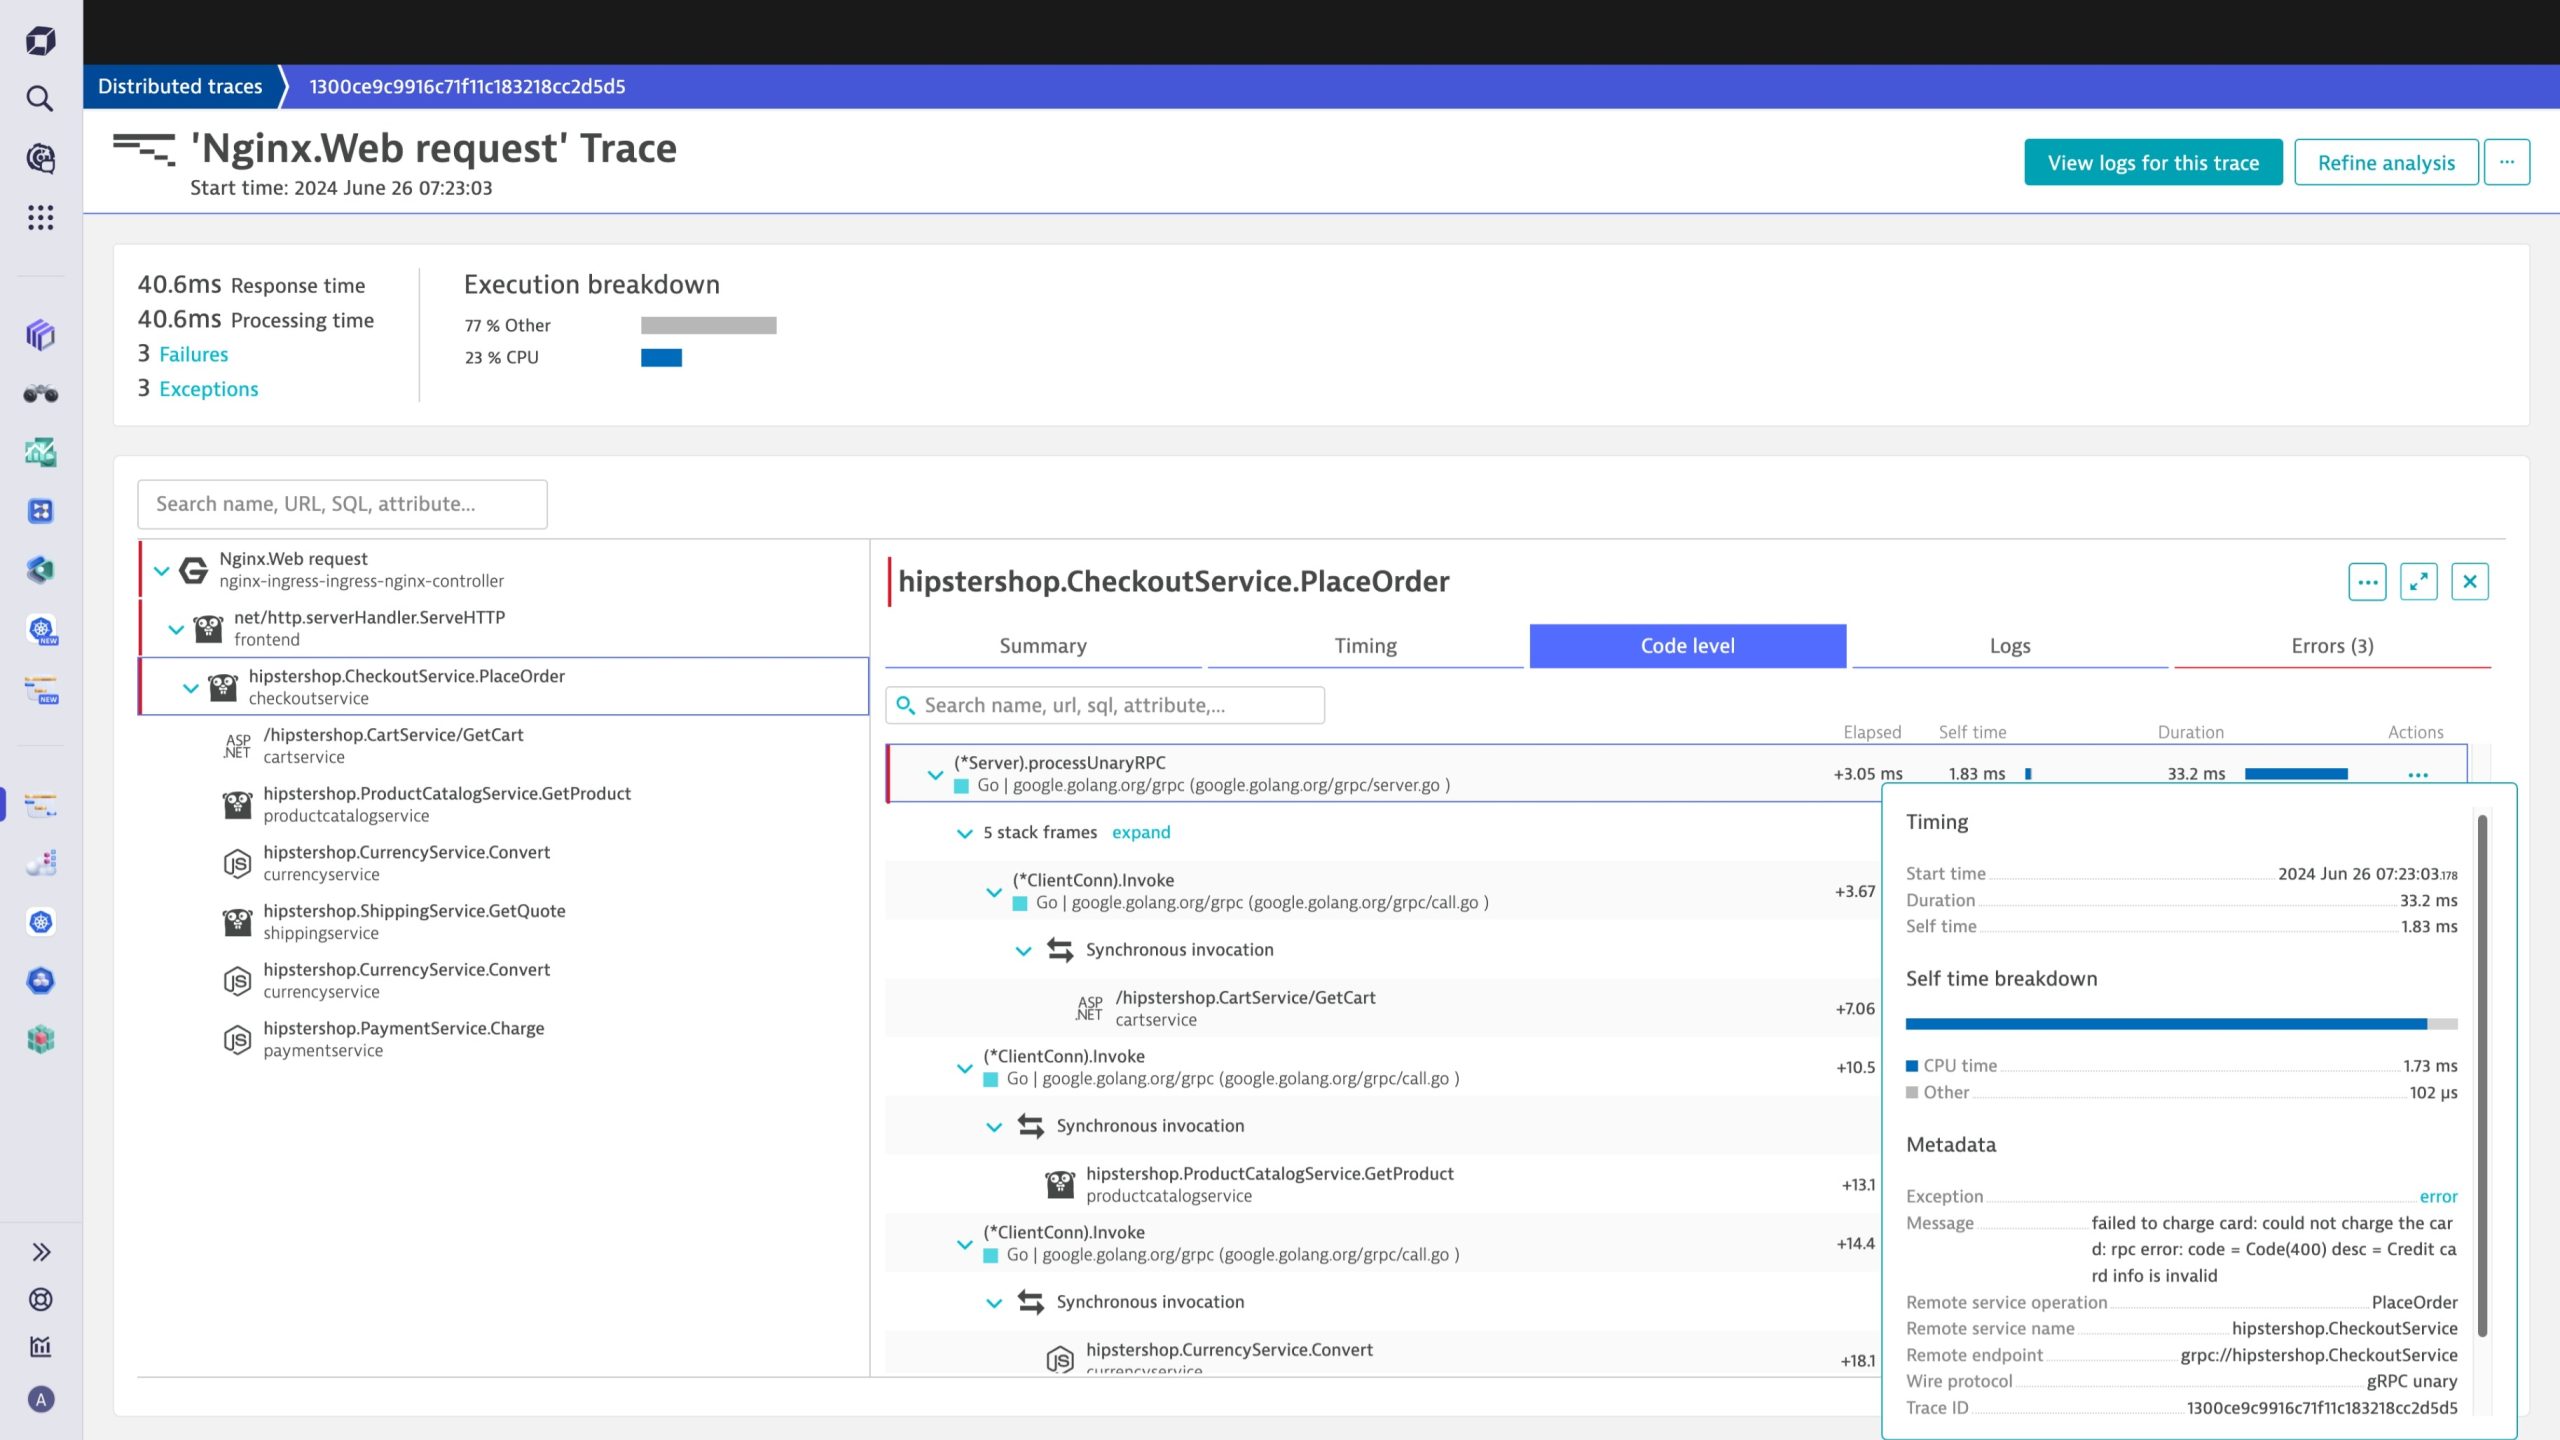
From there, you can drill down to the distributed traces and inspect the spans of the full trace down to the code level that caused the suspicious log line in Kubernetes.

Get started with a simple installation
In addition to an easier troubleshooting process, you benefit from less friction when onboarding.
Dynatrace is tech agnostic, having been purpose-built with cloud-native architectures in mind. This gives you more freedom and flexibility in your workspaces, allowing you to work with whatever tools you already have. Specifically, the release of the Fluent Bit integration gives you two options to get started:
- The in-product onboarding experience lets you quickly roll out a ready-to-use and preconfigured Fluent Bit installation as a DaemonSet. This is the most convenient way to get started. Dynatrace ensures that all logs are properly enriched with metadata to enable context-rich analytics on the platform. You can restrict streaming logs to certain namespaces or pods during the in-product onboarding or customize the created Fluent Bit filters in the yaml file of the used helm chart.
- You can also integrate the required Dynatrace configuration into your existing Fluent Bit installations by adding the required sections. The Dynatrace-specific configurations can be found in the preconfigured yaml file and added to existing and customized Fluent Bit.
Get started on your improved Fluent Bit log streaming journey
Troubleshooting is only the beginning of what you can do with the Fluent Bit integration. Whether it’s seamlessly using logs for health checks to understand why pods are failing, faster innovation, using log data to understand the issue and context of problems detected by Davis® AI in your Kubernetes setup, or investigating security incidents, the options are endless.
Ready to experience the Fluent Bit integration for yourself?
Get started on your log streaming journey and see how the Fluent Bit integration with Dynatrace simplifies your troubleshooting process.
The post Full Kubernetes logging in context: Easily stream logs from Fluent Bit to Dynatrace appeared first on Dynatrace news.
 7 months ago
52