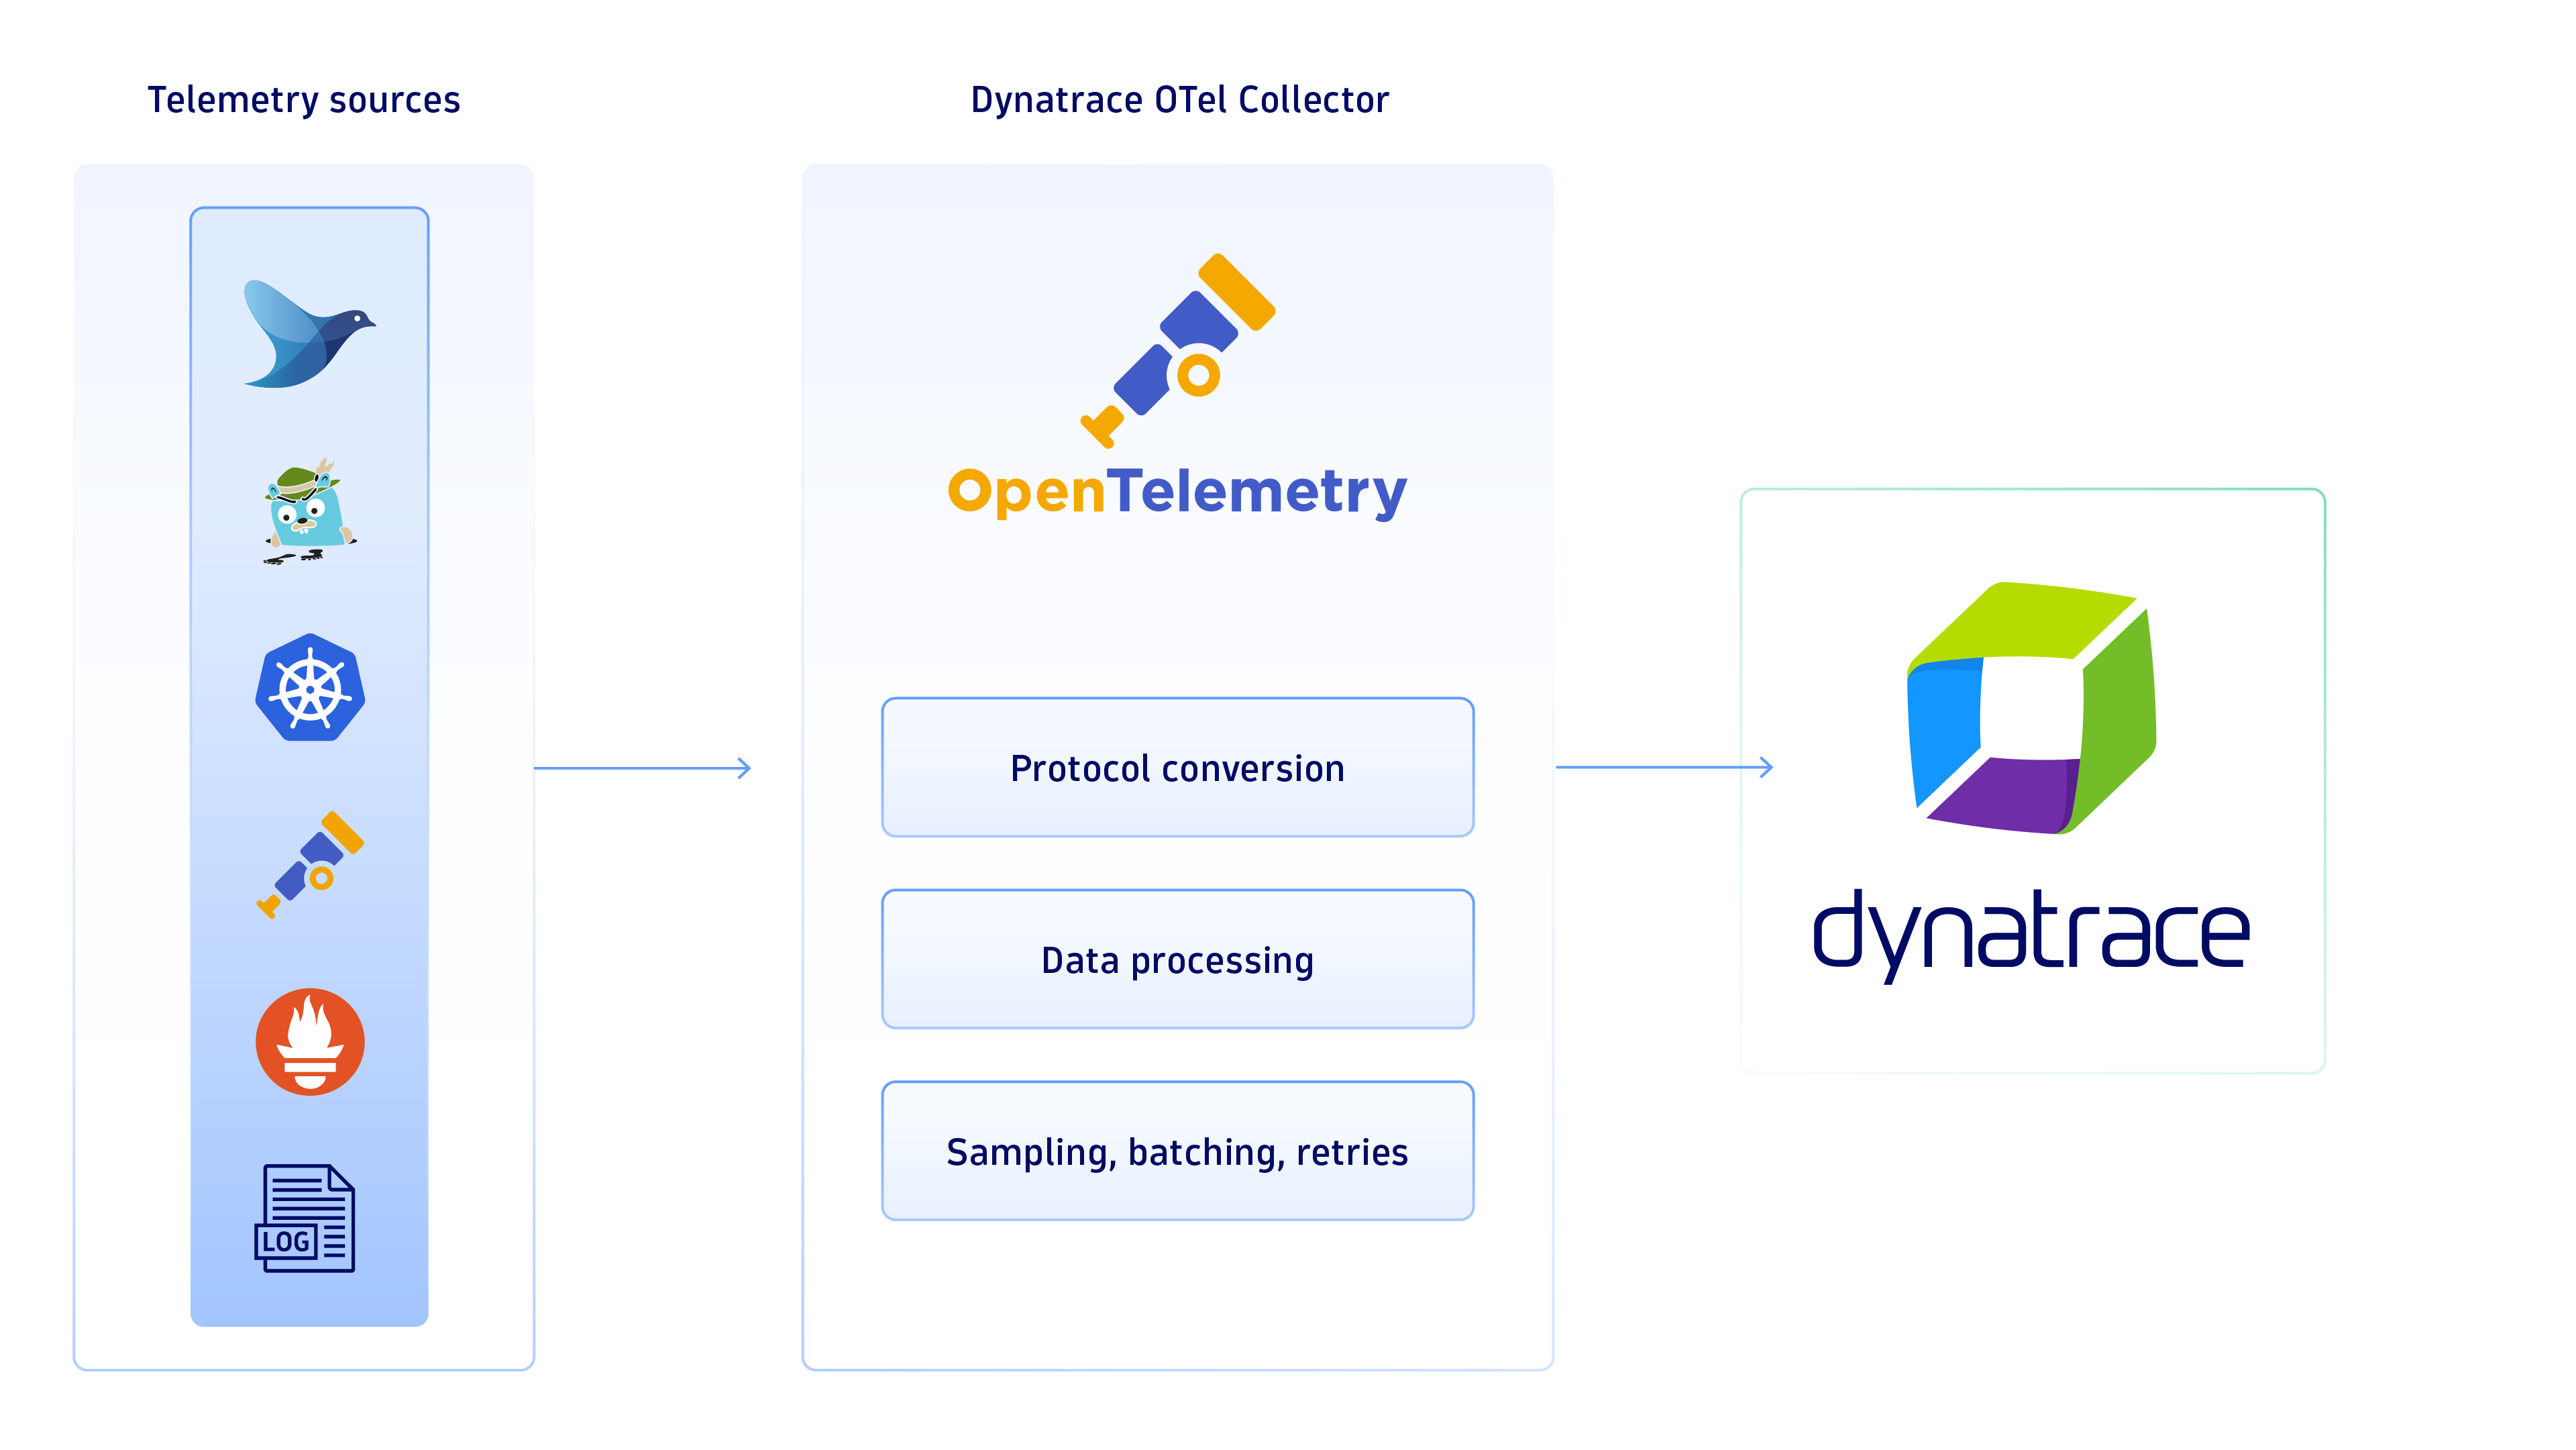
As organizations strive for observability and data democratization, OpenTelemetry emerges as a key technology to create and transfer observability data. OpenTelemetry is gaining popularity because it’s considered a standard, and that’s why it’s a common choice for creating future-proof solutions for years to come.
To answer the growing demand for OpenTelemetry, Dynatrace is proud to announce the release of the Dynatrace OpenTelemetry Collector distribution (Dynatrace OTel Collector). This collector, fully supported and maintained by Dynatrace, is entirely open source. Before we get into the specifics, let’s first recap the benefits OpenTelemetry offers and why using collectors is a best practice.
Understanding OpenTelemetry
OpenTelemetry is an open, vendor-neutral standard for creating, collecting, and transferring telemetry data, like traces, metrics, and logs. Developers and operators can gain insights into their applications and infrastructure without fear of vendor lock-in because OpenTelemetry is fully open source and owned by CNCF. The OpenTelemetry project is supported and maintained by representatives from Microsoft, Google, Amazon, and many others, including Dynatrace.
Why do I need an OpenTelemetry collector?
As the name suggests, an OpenTelemetry collector gathers data from multiple sources and sends it to observability backends, like Dynatrace, for analysis. A collector helps developers control their telemetry data streams for each signal. Different data streams can be directed to different backends or even multicast to multiple backends simultaneously. The configuration is highly flexible in solving various user needs.
A collector is also a powerful component for data processing. It removes the burden of managing retries, batching, and sampling from monitored applications, which can reduce the CPU and memory requirements of applications. A collector can also transform and enrich the data with additional context. For example, in a Kubernetes environment, a collector can automatically attach metadata about pods and namespaces to all observability data. This ensures that application telemetry is contextualized with the infrastructure, enabling the observability backend to link the application and infrastructure for enhanced insights and root cause analysis.
From a user perspective, a collector can also serve as an open source platform that can be extended with custom components. You can create internal collector components of your own, for example, to receive telemetry data in a special format or to process it in a certain way. Using a collector as a telemetry processing platform can be much easier than creating an entirely new application.
Why the Dynatrace OTel Collector
The OpenTelemetry community releases different distributions of the collector, many of which our customers use to send OpenTelemetry data to Dynatrace. So, why should you consider using the Dynatrace Otel Collector? Quite simply, support and stability.
We have seen many customers identify collectors as a potential solution for their needs. Still, they haven’t been able to deploy collectors in production due to the lack of support. Deploying an open source component without external support and the needed expertise is undoubtedly a risk. That’s why we provide Dynatrace customers with a Dynatrace-supported solution.
The Dynatrace Otel Collector comes with collector components that have been verified by Dynatrace for seamless operation. This removes the burden of manually validating each component and use case. To further help you with your collector journey, we publish configuration examples of typical Dynatrace use cases and best practices to provide a good starting point.
The Dynatrace Otel Collector includes components that we know run stably in production, which means we can offer full Dynatrace support. At the same time, innovations from the OpenTelemetry community can be added to the Dynatrace Otel Collector only after they are mature enough and have proven their stability.
Deployment and the typical use cases
The Dynatrace Otel Collector can be deployed on Kubernetes or Docker using a provided container image or directly on a host with the published binary. For more details, refer to our Dynatrace OTel Collector deployment guide.
In the initial release, the Dynatrace Otel Collector comes with components for:
- Receiving, processing, and exporting OpenTelemetry protocol (OTLP) for traces, metrics, and logs
- Integrating Jaeger, Prometheus, and different log protocols, such as syslog, Fluentd, and log files
- To learn more about ingesting log data over syslog with the new Dynatrace OTel Collector, see the blog post Bring syslog into Dynatrace over OpenTelemetry to get open source value with enterprise support.
Additionally, the Dynatrace Otel Collector includes a rich toolset for data processing to enrich, filter, transform, sample, and batch. The complete list of the components is available in our GitHub repository.

What’s next
After the initial release, we’ll continue enhancing the Dynatrace OTel Collector with new features and capabilities to make it even easier to integrate with Dynatrace. We also intend to offer more automated methods to deploy the collector with pre-configurations. So, stay tuned.
As a significant contributor to the OpenTelemetry project, Dynatrace remains committed to working with the community and other vendors to enrich its capabilities and make it user-friendly for everyone.
Deploying the Dynatrace Otel Collector takes only minutes and uses the tooling you already know: standalone binary, Docker image, Kubernetes Operator, Helm chart, or a standard manifest file. The configuration maps one-to-one with the collector distributions from the OpenTelemetry community.
The post Enhance data collection with Dynatrace OpenTelemetry Collector distribution appeared first on Dynatrace news.
 11 months ago
58