Mainframe is a strong choice for hybrid cloud, but it brings observability challenges
IBM Z is a mainframe computing platform chosen by many organizations with a hybrid cloud strategy because of its security, resiliency, performance, scalability, and sustainability. With the availability of Linux on IBM Z and LinuxONE, the IBM Z platform brings a familiar host operating system and sustainability that could yield up to 75% energy reduction compared to x86 servers.
That’s why a hybrid cloud scenario, where workloads are shared between public clouds and highly performant mainframe platforms like IBM Z, is a robust and effective strategy.
The challenge for hybrid cloud deployments is maintaining critical observability, which must include the full set of monitoring signals: logs, metrics, and traces. Without combining these signals in a unified AI-powered observability platform, monitoring apps, infrastructure, and troubleshooting issues are nothing more than a patchwork of manual correlation.
Deploying your critical applications on additional host operating systems increases the dependencies for observability. It means maintaining platform-specific observability components or tools, managing security updates, and deploying changes, all of which lead to configuration spread.
This creates a risk that can impact your time to problem resolution in troubleshooting, the effectiveness of AIOps workflows to remediate issues before they affect your end-users, and ultimately your business metrics.
Logs become an integrated part of observability
Dynatrace provides a unified and integrated platform to observe such hybrid cloud deployments, now with added support to monitor logs effortlessly on Linux on IBM Z and LinuxONE.
OneAgent® is a core component of the Dynatrace platform; it enables observability with minimal setup effort while offering extensive and flexible central configuration options. By including logs in your hybrid cloud observability, you have everything you need in one place to make smarter, faster decisions when troubleshooting and measuring the health of your application environments.
You can now seamlessly expand your analysis of the root cause of any problem identified by Davis® AI with logs automatically available in the correct context of hosts, applications, or other identifiers specific to your environment.
Because Dynatrace provides a unified and central place to configure your observability, there is a single place where you manage your log collection for public and private clouds and mainframe components like Linux on IBM Z or LinuxONE.
This makes your log collection policies much more effective and transparent. You can push a filtering change to filter out all unwanted logs from your central Dynatrace environment and apply the change automatically to all your monitored platforms.
It’s also easy to minimize the risk of violating data access policies or regulations by masking sensitive data in logs. By centrally configuring masking rules for sensitive data, you can push the rules out to all of your deployed OneAgents wherever they are deployed to make sure you stay compliant.
Configure log collection across all your hosts
Start by deploying OneAgent for Linux on IBM Z by going to Deploy OneAgent (for earlier versions of Dynatrace and Dynatrace Managed deployments, go to Settings > Deploy Dynatrace), choose Linux as the underlying platform, and s390 as the installer type.
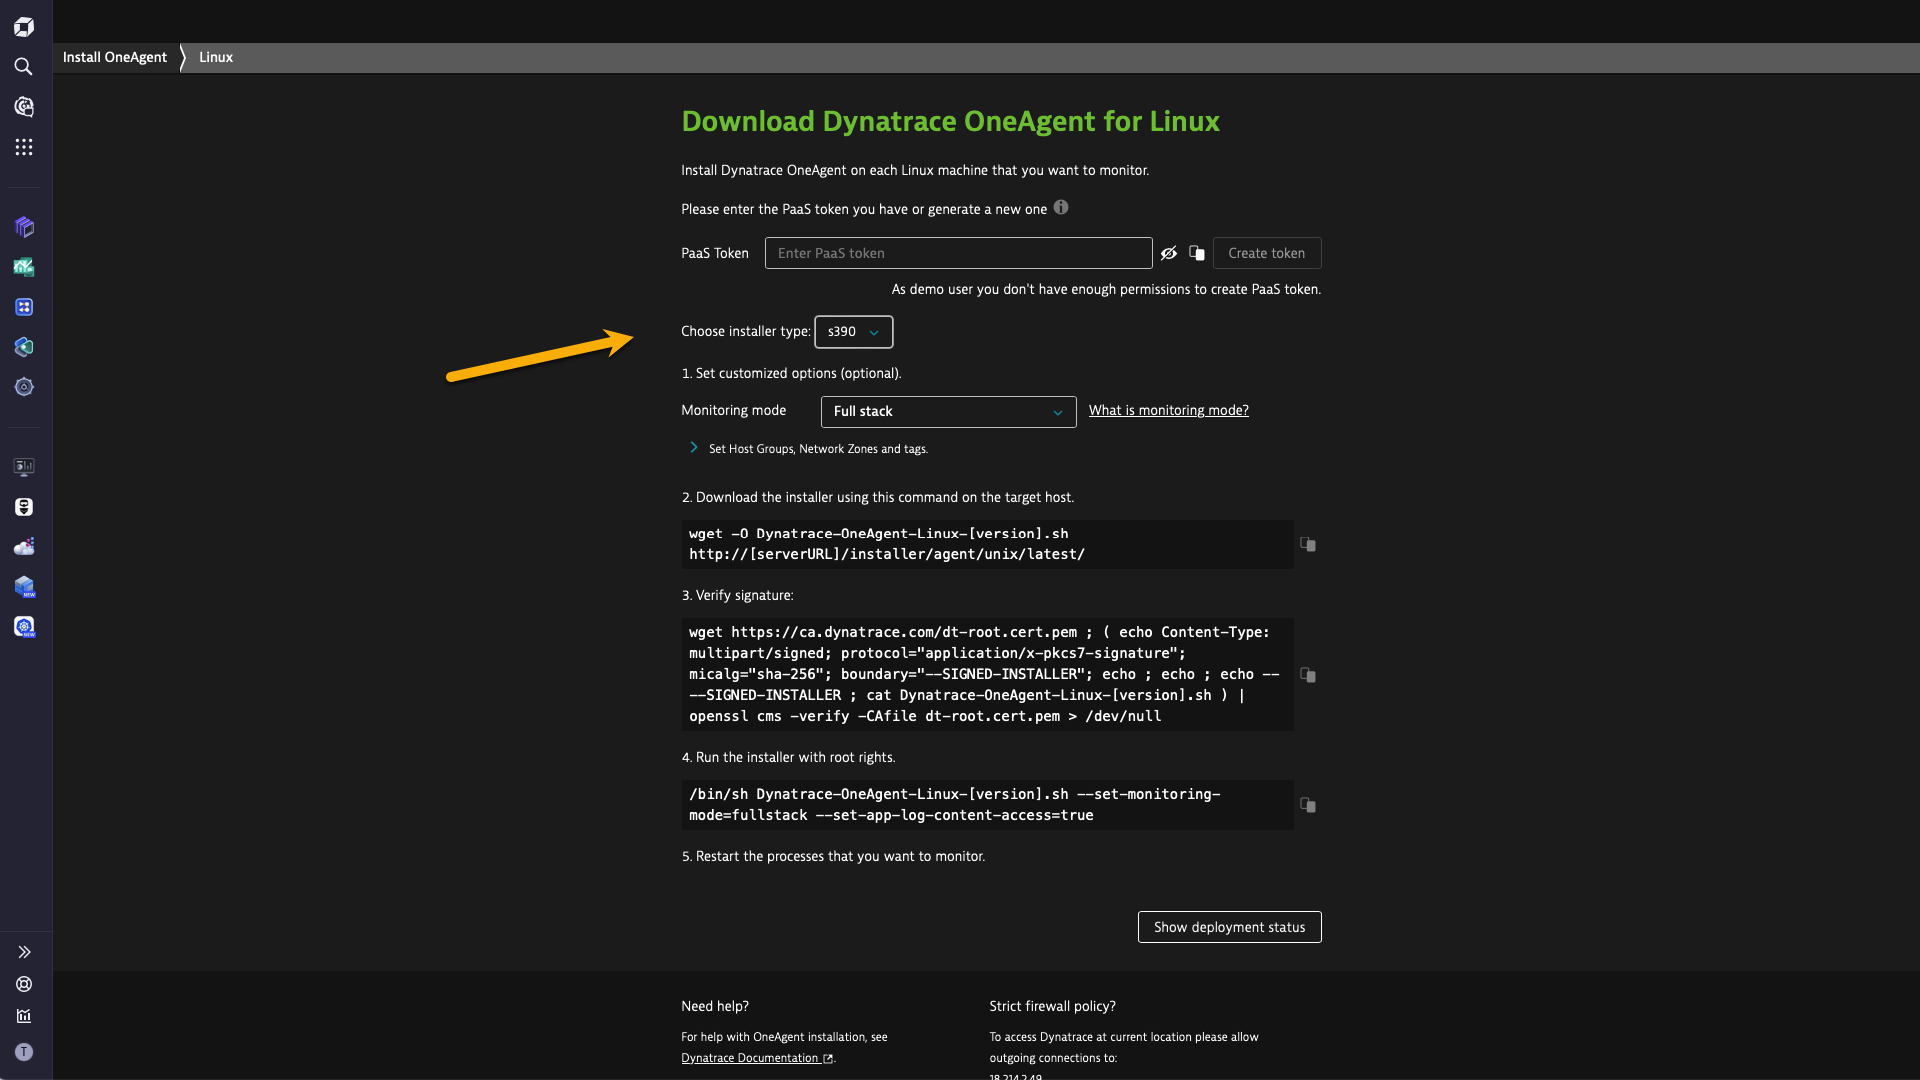 Figure 1. You can now install OneAgent on Linux with s390 architecture.
Next, set up log ingest. As log monitoring is now available with OneAgent for Linux on IBM Z, a single log ingest rule can cover all your Linux operating systems no matter what architecture is utilized under the hood. This means OneAgents deployed on Linux with s390, ARM, AIX, or x86 are covered.
Go to Settings > Log Monitoring > Log ingest rules and turn on Ingest all logs to start log collection.
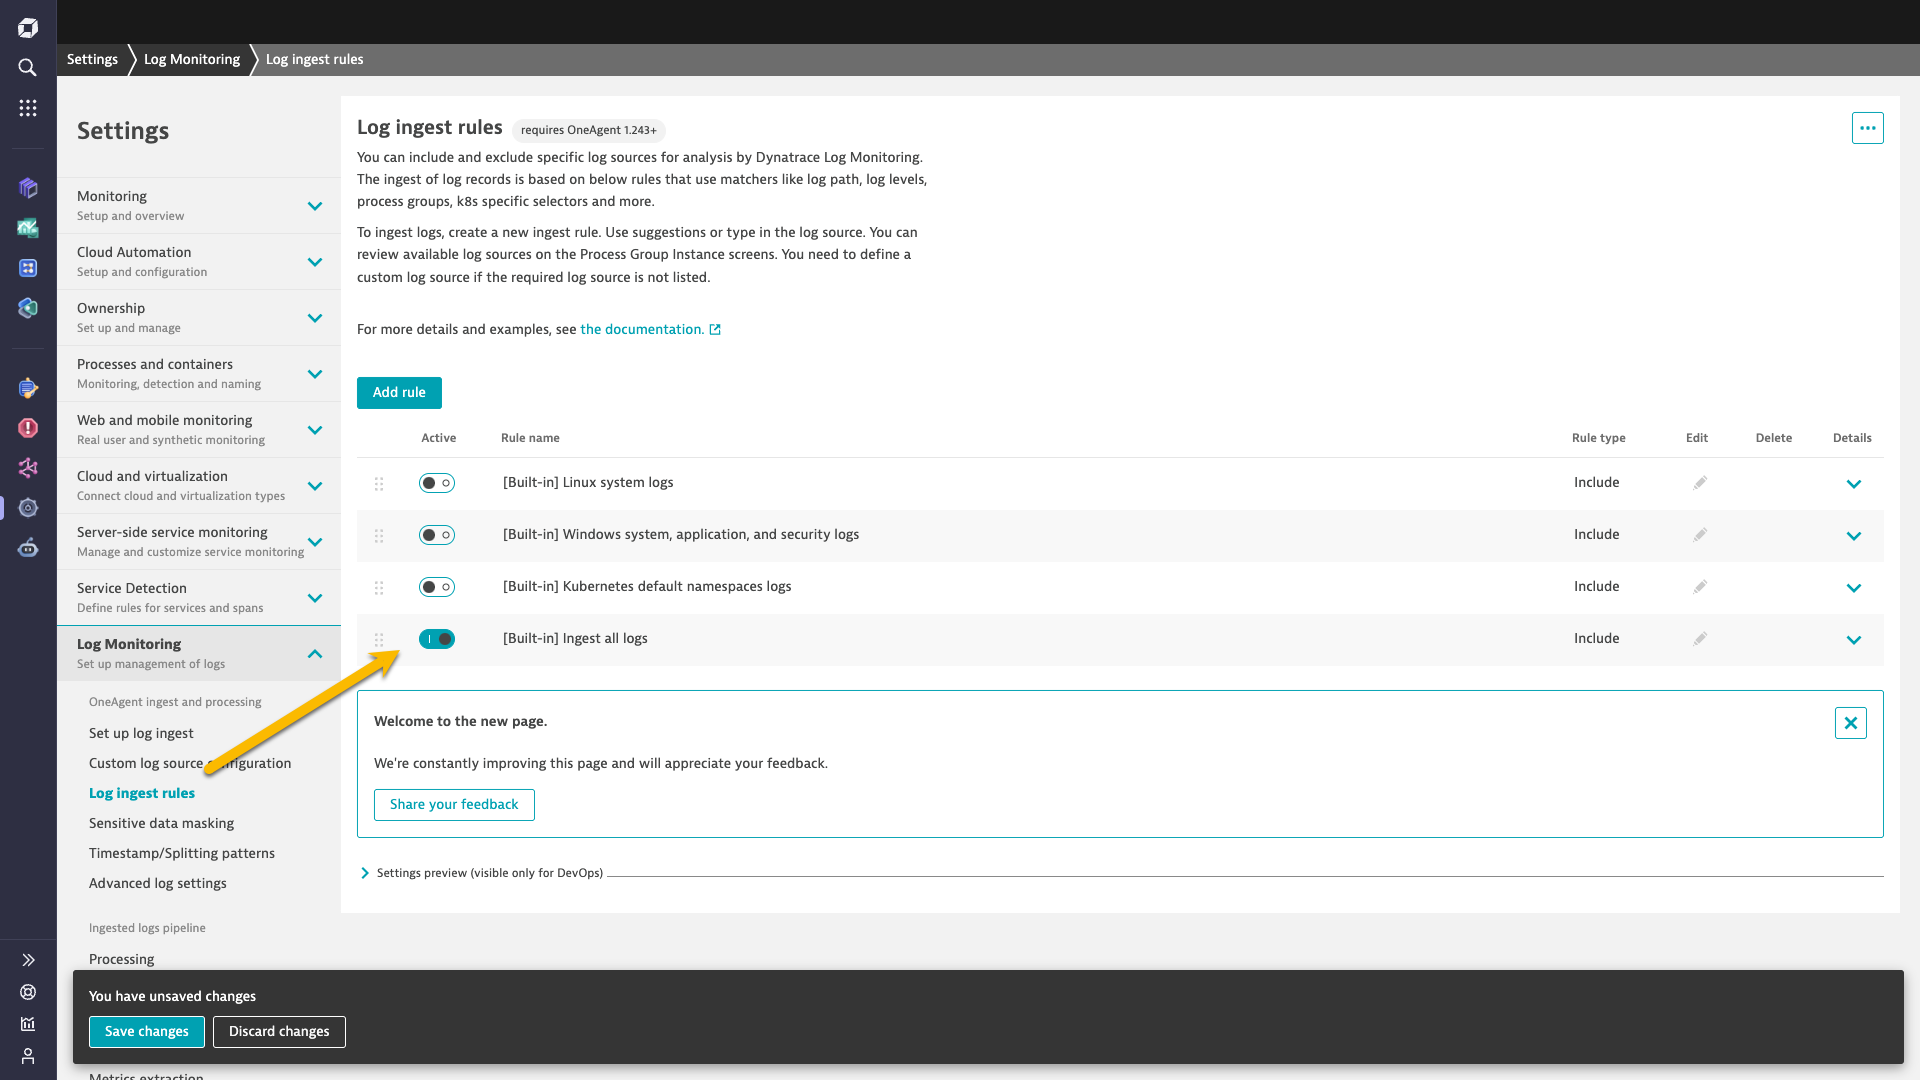 Figure 2. Enabling the log ingestion setting applies to deployed OneAgents on Linux on IBM Z and LinuxONE.
Next you can start using logs in your troubleshooting and analysis tasks. For example, on the Dynatrace platform, open the new Infrastructure & Operations app and navigate to any monitored host running on Linux on IBM Z (s390 architecture). You can see the Logs tab for the host, which displays insights about automatically contextualized logs from that host.
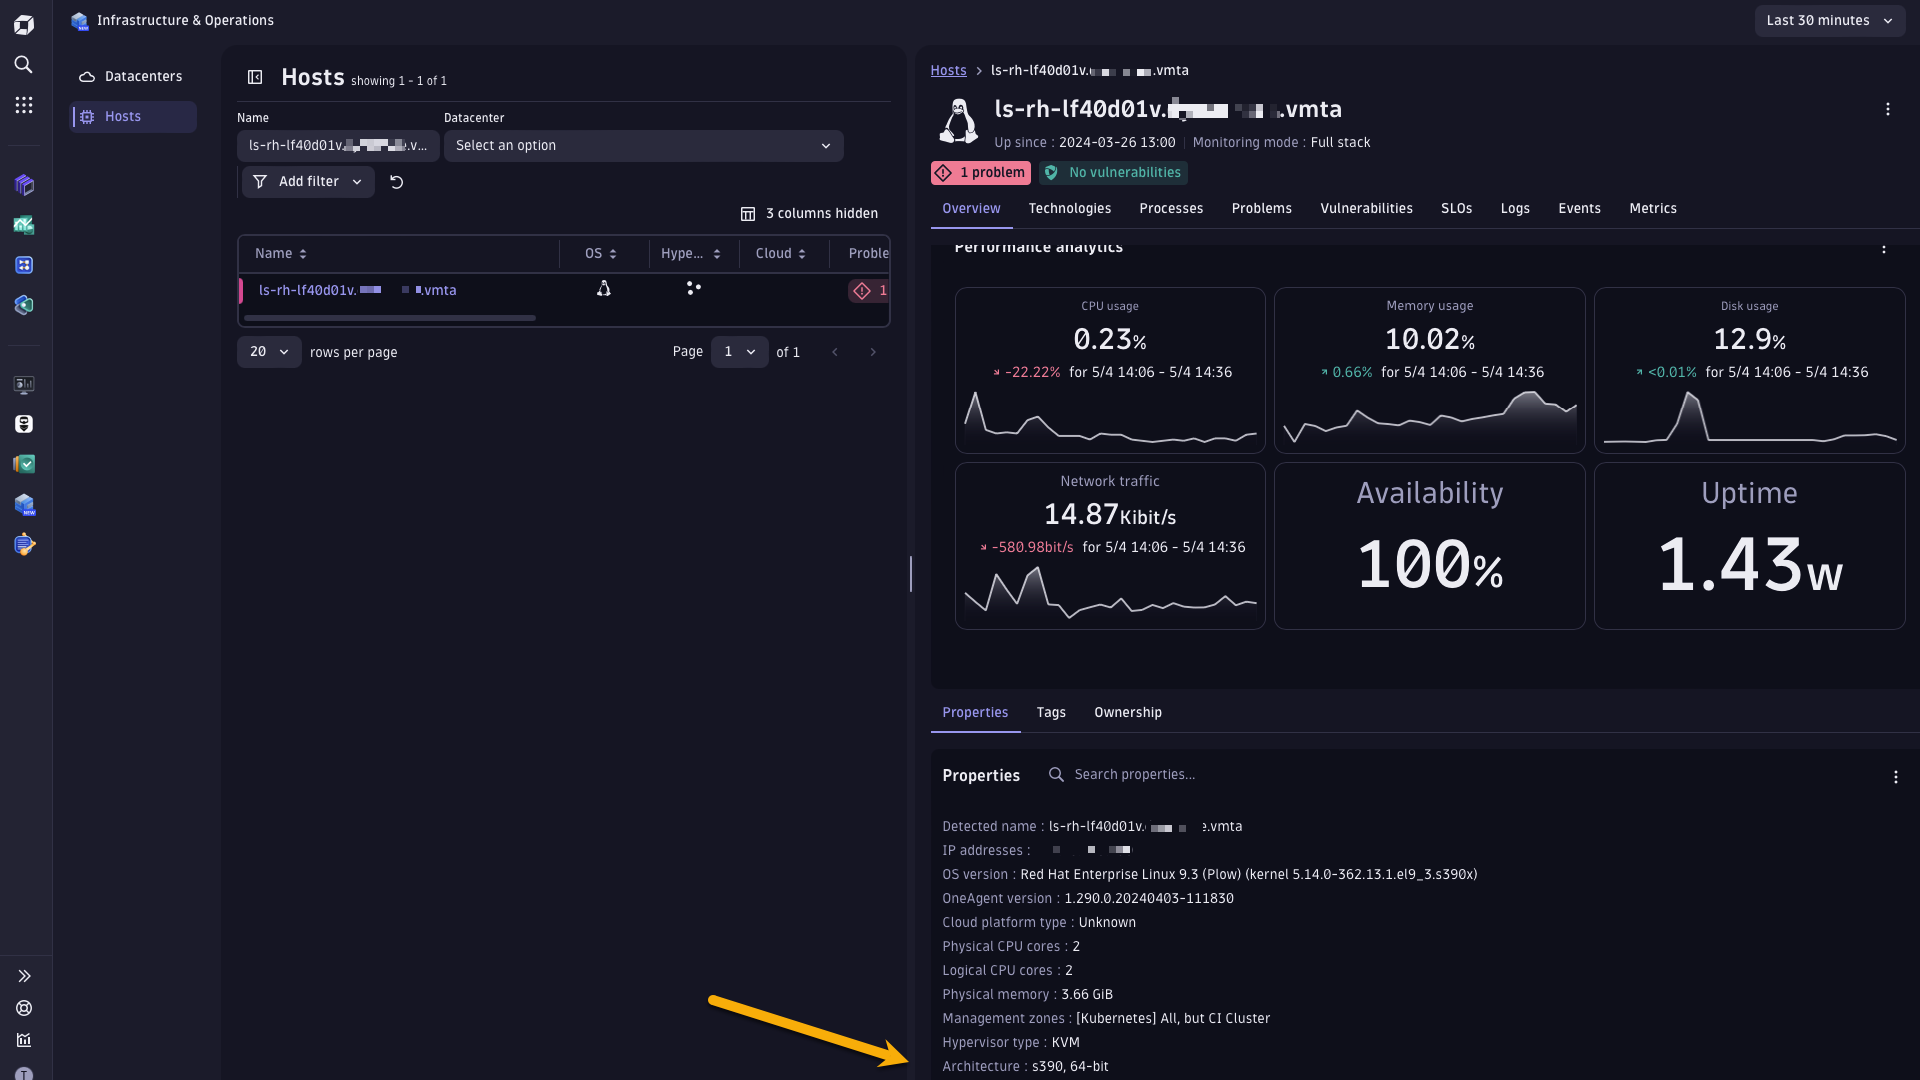 Figure 3. The infrastructure & Operations app shows a monitored host with s390 architecture, and the Logs tab shows log data for that host.
You can take your Dynatrace Grail™ analysis of log data further in Notebooks. Start with a query builder to get error logs for your Linux on IBM Z hosts, and continue your exploration with Dynatrace Query Language.
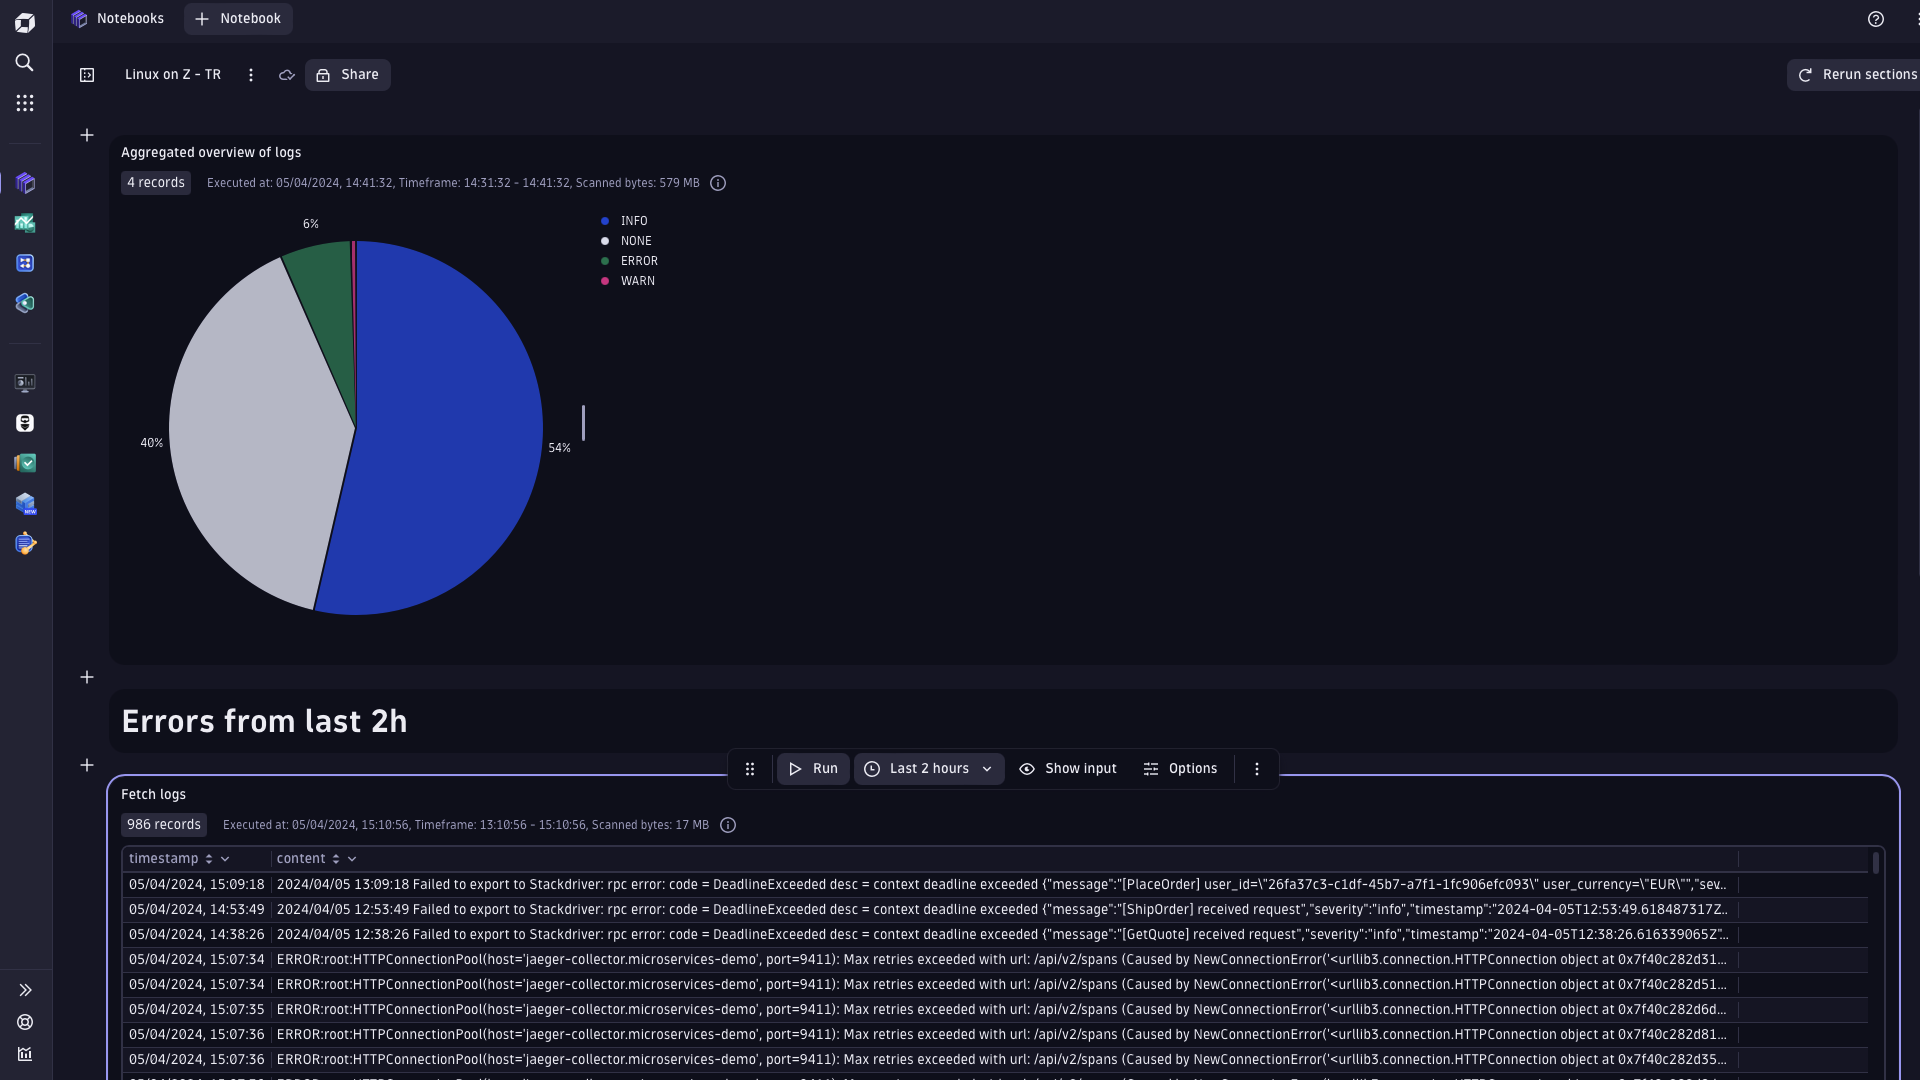 Figure 4. Error logs in Notebooks with distribution chart
Start monitoring logs on Linux on IBM Z
- Support for OneAgent log monitoring in Linux on IBM Z and LinuxONE is available with Dynatrace version 1.287.
- See documentation for monitoring logs with OneAgent, or see details in the OneAgent capability support matrix
- Install OneAgent to start monitoring logs on Linux s390 architecture
What’s next
Stay tuned for an upcoming blog post about log collection in OpenShift for Linux on IBM Z and LinuxONE.
Are you running containerized applications on IBM Z?
The post Enable full observability for Linux on IBM Z mainframe now with logs appeared first on Dynatrace news.
 10 months ago
69