 1 day ago
3
1 day ago
3
Developers are key stakeholders in modern observability. Their responsibilities have stretched dramatically in the last few years, together with their tasks and challenges. Historically, the industry focused more on operational-driven observability but has since begun to include—amplified by shift-left movements—developers’ unique needs. In this blog post, we will see how Dynatrace harnesses the power of observability and analytics to tailor a new experience to easily extend to the left, allowing developers to solve issues faster, build more efficient software, and ultimately improve developer experience!
What developers want
Developers want to own their code in a distributed, ephemeral, cloud, microservices-based environment. This ownership starts with understanding how their code behaves in all environments, resolving issues, and writing and optimizing code in a high-quality, secure, and timely manner.
Building the dream package
Observability for Developers, the newly introduced offering from Dynatrace, is designed to cater to developers’ specific needs and challenges. It packages the existing Dynatrace capabilities needed by developers in their day-to-day work—such as logs, distributed traces, profiling data, exceptions, and more. It combines all of these with dynamic instrumentation capabilities and experience to tackle production bugs and optimize developer tasks and resources.
The Observability for Developers initial offering includes the following:
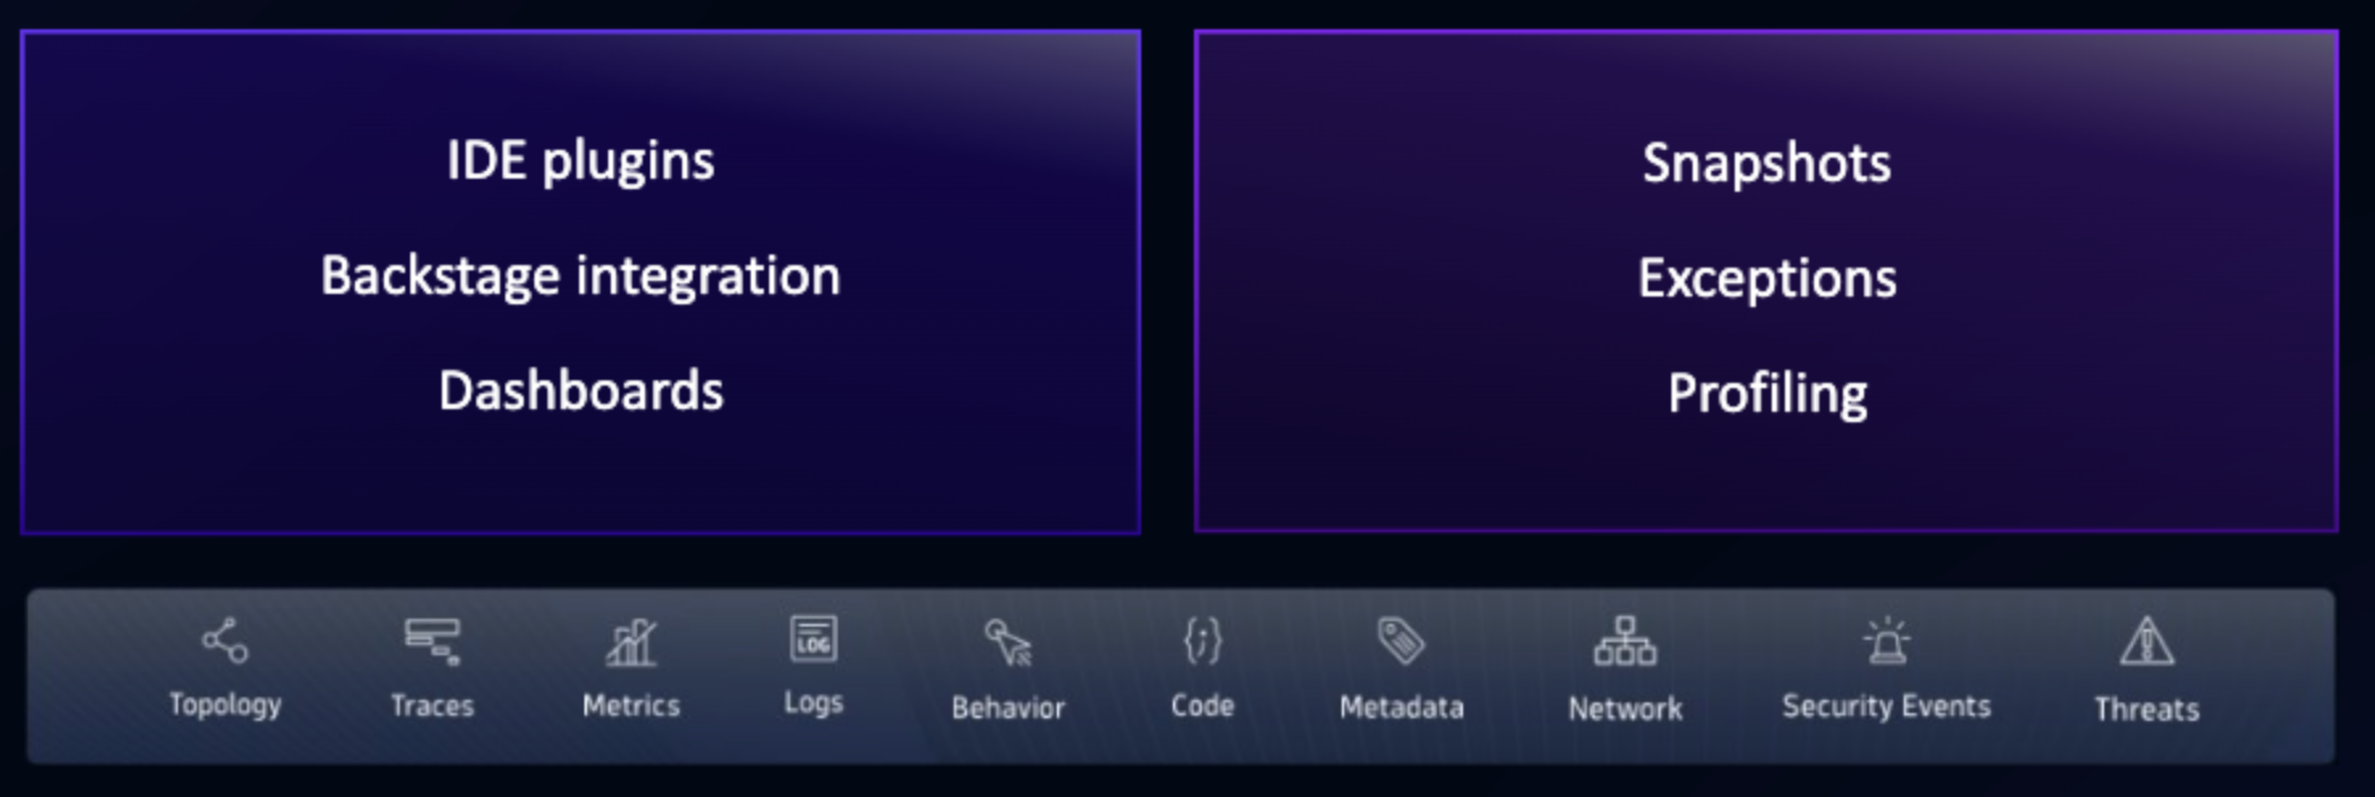
This package provides development and cloud-native teams with powerful capabilities:
- Easy data access and exploration: Intuitive dashboarding and advanced log and trace analytics powered by Davis AI make it easy to track and optimize application performance, monitor health, analyze end-user interactions, view historical data, and provide forecasting all in one place.
- Enhanced troubleshooting power: Dynatrace troubleshooting capabilities—backed with AI power and automatic root cause analysis—are now further supported with live production debugging capabilities.
- Live Debugger enables developers to access real-time insights from runtime environments without requiring issue reproduction or redeployments, extract debugging information without performance impact, and leverage contextual insights for rapid problem resolution.
- Enterprise adoption with self-service: To facilitate enterprise adoption while minimizing tool sprawl and data silos, Dynatrace allows observability teams and platform engineers to implement a self-service model for developers. Tailored entry points and integrations with developer portals and integrated development environments (IDEs) unlock easy access to all functionalities while maintaining a curated and compliant approach, adhering to company standards.
Dashboards: Insights at a glance
While writing code is the primary focus of most developers, ensuring that their services and applications maintain a stable and reliable state is essential for their peace of mind.
Dashboards are a great tool for gaining real-time insights into applications by transforming complex data into dynamic, interactive visualizations. In a single view, developers get an instant overview of application performance, system health, logs, problems, deployment status, user interactions, and much more.
They can even combine this with data from external sources or add custom code to address bespoke requirements. Quickly access your data through seamless integration with other Dynatrace® Apps such as Kubernetes, Logs, Clouds, Services, and more. Benefit from dynamic filtering and cross-data-type visualizations to never lose track of your application’s health.
To get started, use one of many ready-made dashboards or start building custom, interactive dashboards within minutes.
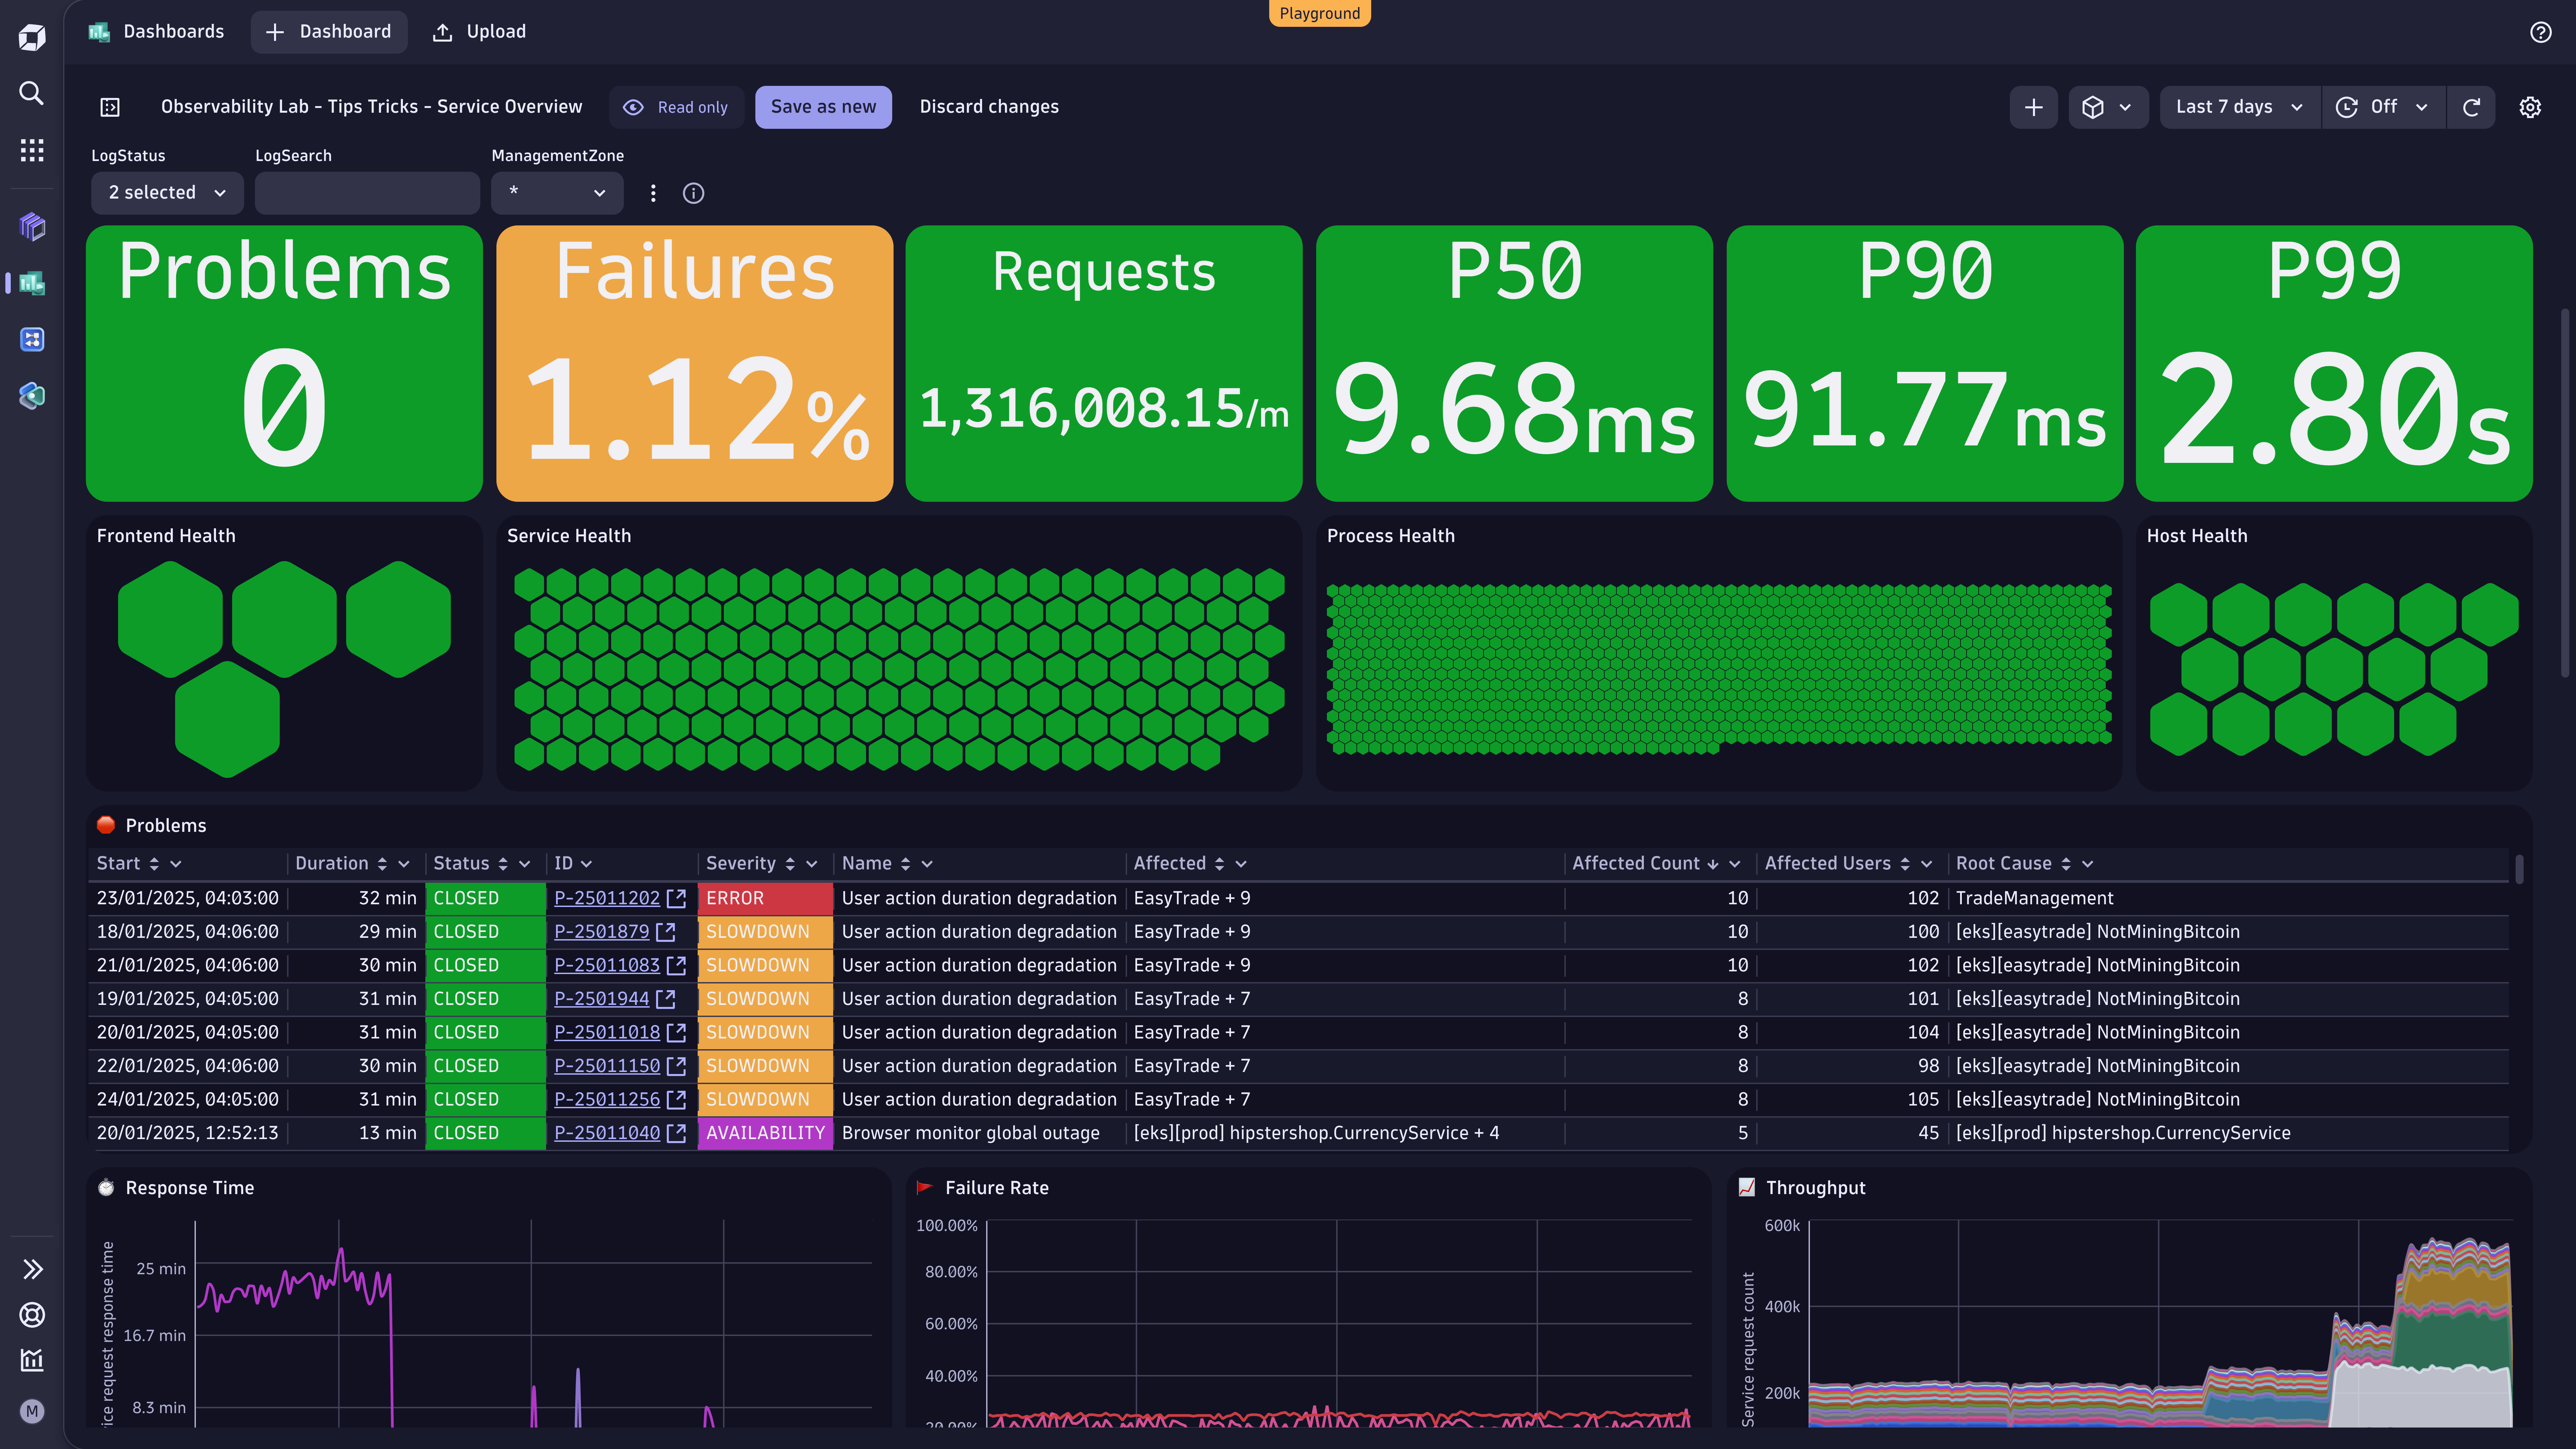 All your services-related data on one dashboard
Davis AI is your CoPilot
The Problems app offers a comprehensive, AI-assisted problem-triage and remediation solution tailored for the entire software development lifecycle, from development to operations. Visually guiding users and automatically surfacing critical details allows for faster mean time to repair (MTTR). This efficiency is achieved using Davis® AI to identify root causes, pinpoint relevant details, and visually reproduce them in charts, highlighting the affected deployment.
When a large-scale incident occurs, Davis AI identifies the root cause and connects all relevant log lines. As every developer knows, logs are crucial for uncovering insights and detecting fundamental flaws, such as process crashes or exceptions. When identifying a root cause, Davis causal AI collects all relevant logs and automatically connects them to the underlying issue, making them easily accessible in the Problems app. Additionally, Dynatrace integrates relevant trace data, providing full visibility into complex, microservices-based architectures.
Read our blog post about recent enhancements to Problems, including using Davis CoPilot to get a written summary of issues, as well as tips for problem resolution and how to use generative AI for automatic remediation.
Log Analytics: Get desired logs on the fly, enriched with contextual data
Dynatrace Log Management & Analytics empowers developers and enhances their productivity by supporting them with easy-to-use yet powerful filtering capabilities. The DQL Editor allows power users to craft their own queries, or to translate the filters into DQL snippets.
In any case, far less manual filtering is required as Developers are provided with logs in the context of related entities, traces, and services. This eliminates time-consuming manual log file correlation between otherwise siloed application-, cluster-, and service logs.
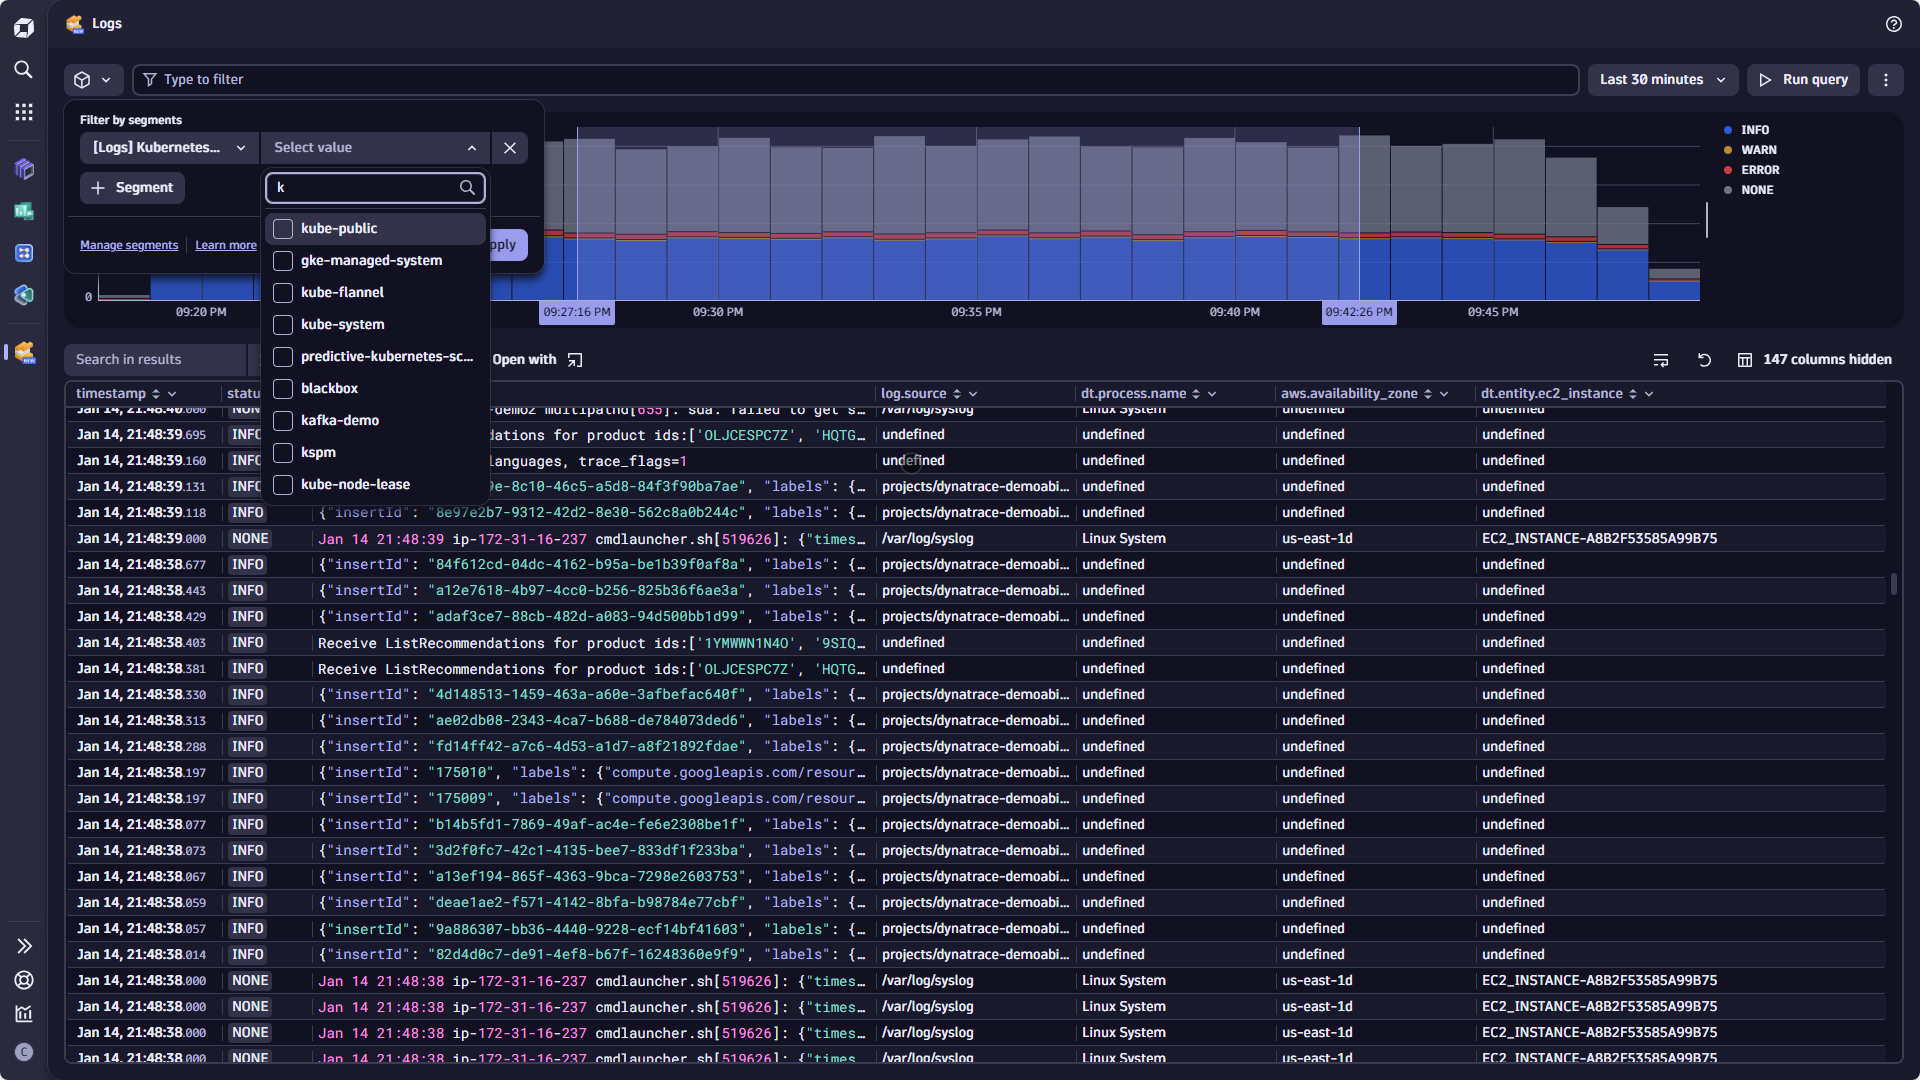
Your desired log on the fly, enriched with contextual and AI data
Distributed tracing: Quickly understand dependencies, interactions, and bottlenecks
Dynatrace distributed traces offer a wealth of information, offering nearly anything you can imagine, helping you navigate and understand complex microservices architecture. Traces combine multiple layers of spans and logs in a structured manner, providing you with method names, call arguments, exceptions, execution times, version information, and so much more. Dynatrace provides a detailed view of application transactions across microservices architectures, enabling you to track requests from start to finish. This visibility helps quickly identify bottlenecks and performance issues, reducing mean time to resolution (MTTR). Developers gain insights into service interactions and dependencies, allowing for faster debugging and improved application performance. Distributed tracing enhances user experience and application reliability by optimizing workflows and ensuring seamless operation, empowering developers to deliver high-quality, efficient software solutions.
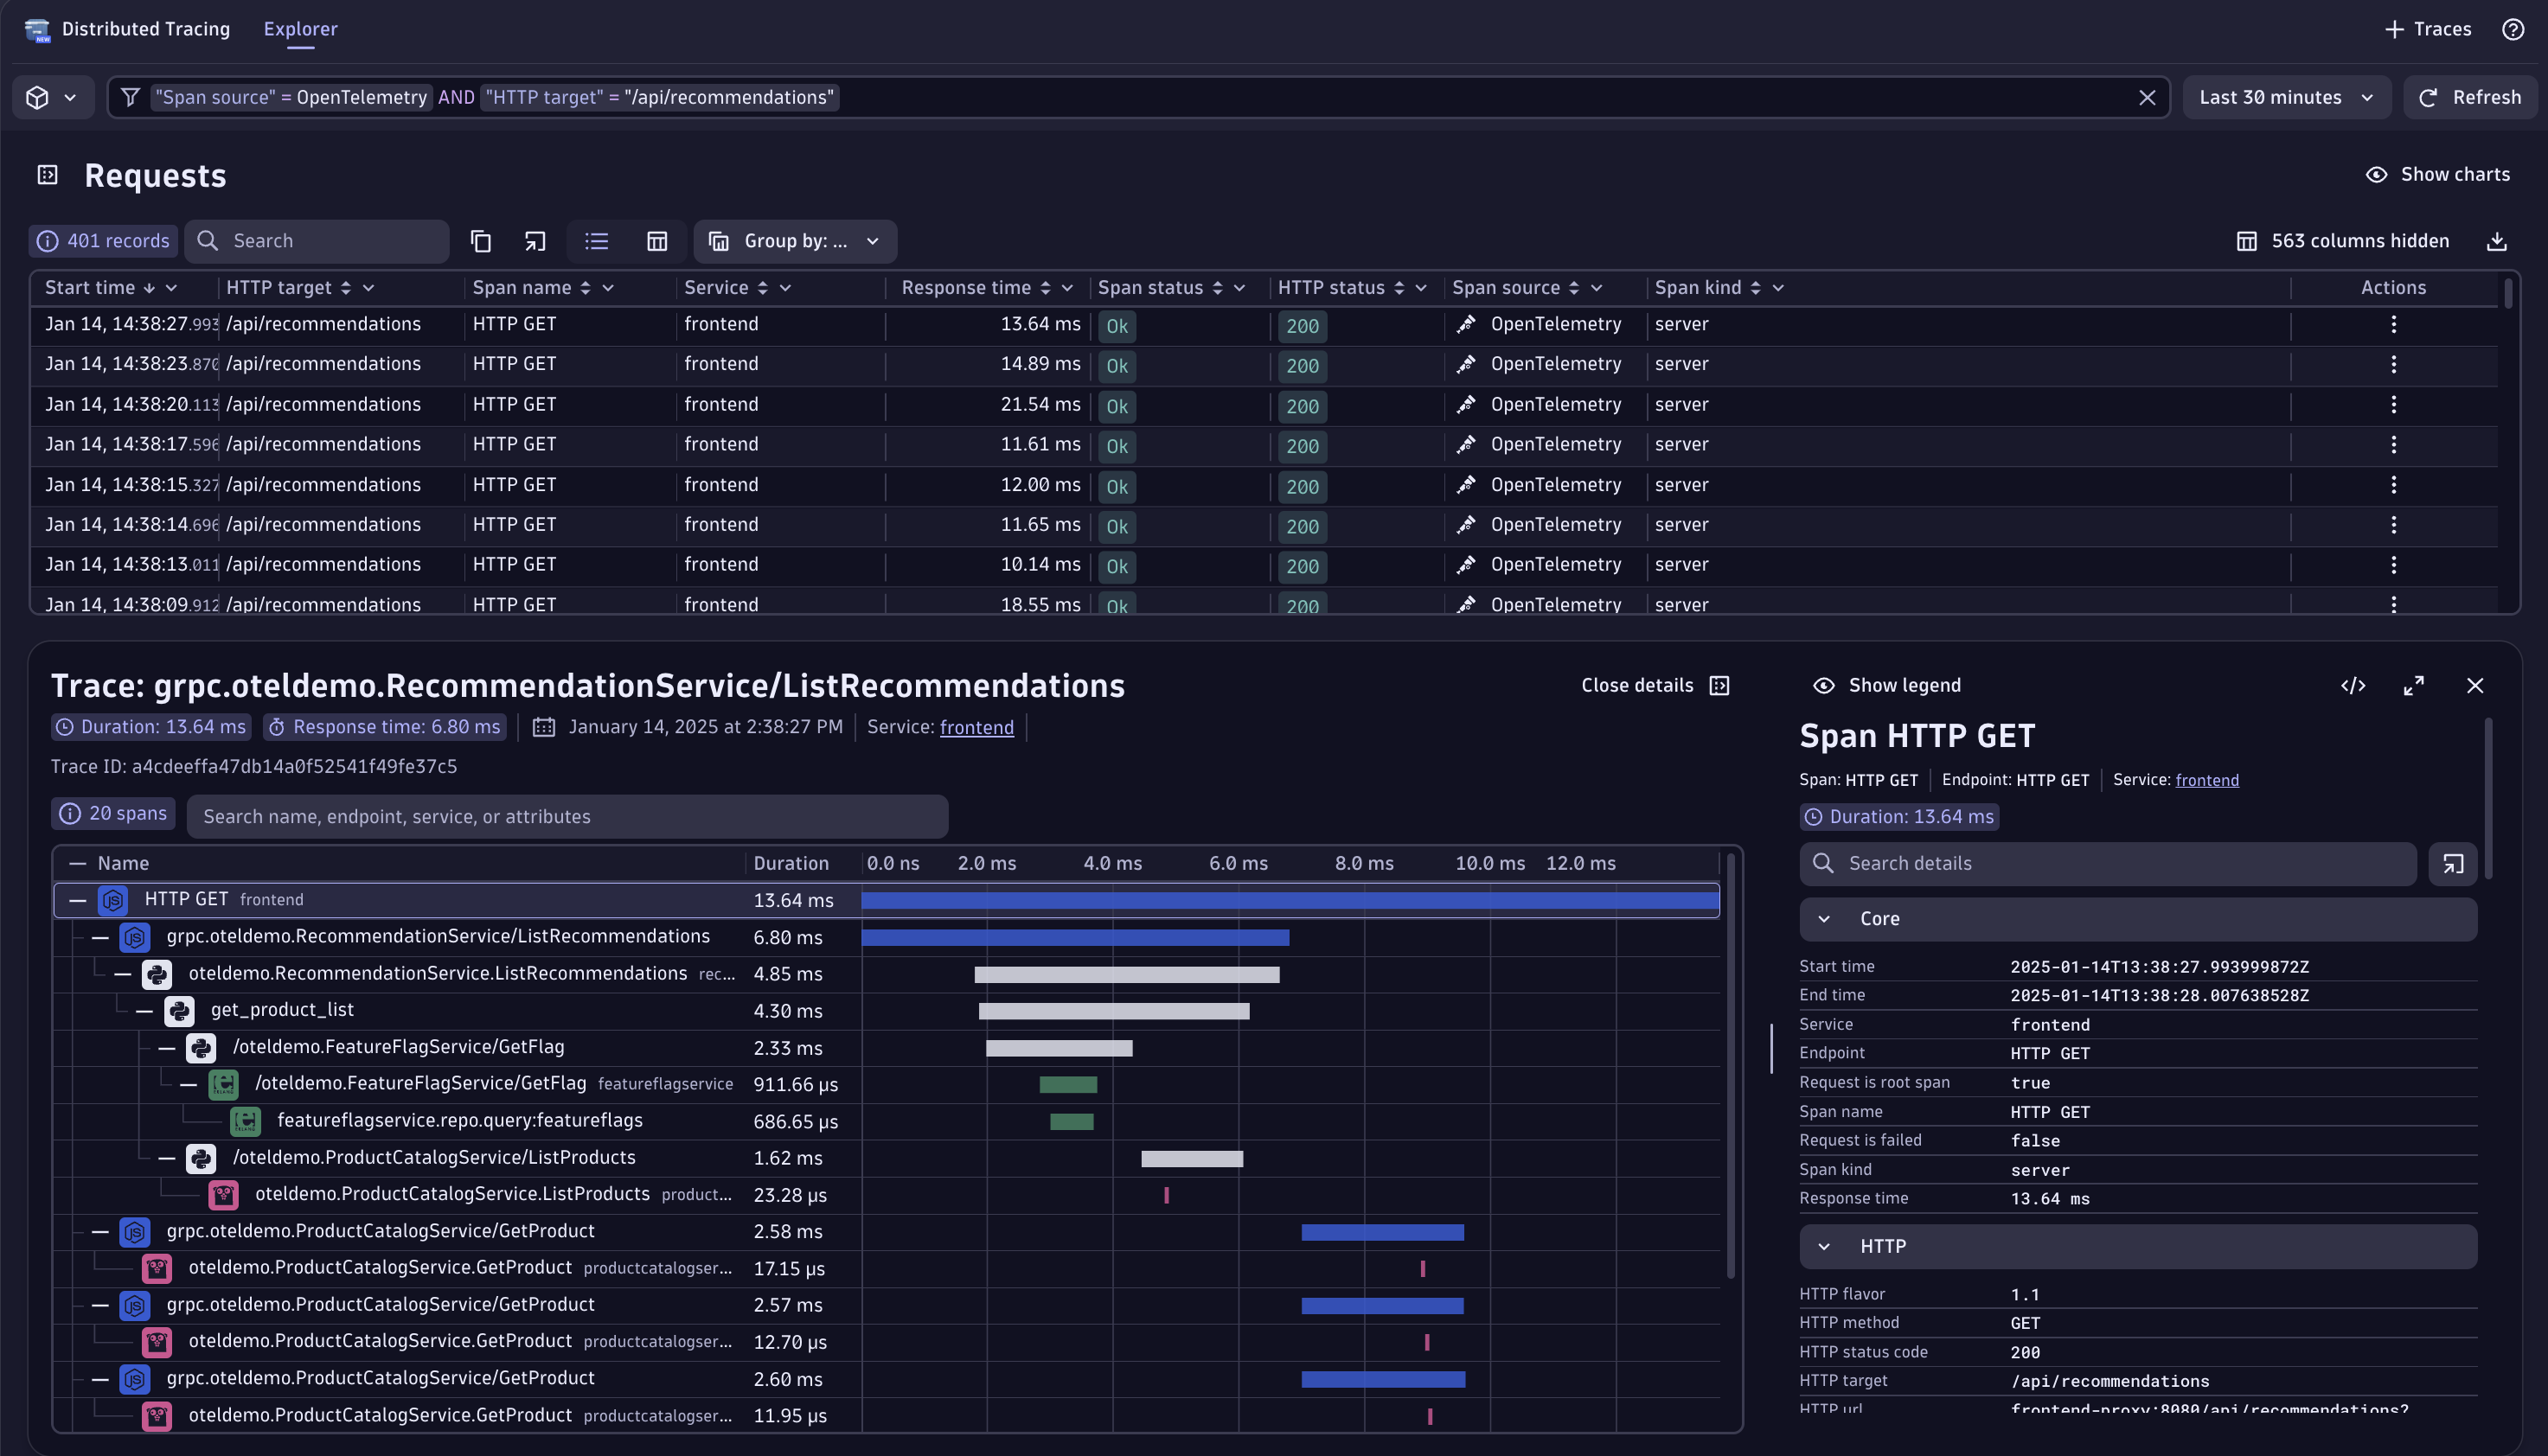 Clear insights with E2E single trace visibility
Live Debugger: Get code-level data from production in real time
The new Dynatrace Live debugger app provides real-time access to code wherever it’s running, from dev to prod environments. Developers can set a non-breaking breakpoint without interfering with the runtime. The captured debug data includes stack trace, variable values, process, and more, drastically reducing debug cycles and enhancing efficiency as error reproduction and time-consuming redeployments are now a thing of the past. Developers can access this capability directly from the Dynatrace platform or by using our native Visual Studio Code and JetBrains IDE plugins. With the ability to analyze live application behavior and track down issues as they occur, developers gain immediate visibility into their code’s execution. This leads to faster resolution of bugs and improved application performance, ultimately empowering teams to deliver high-quality software with greater confidence and improved experience.
Read more about the Live Debugger application in our blog post – Dare to debug production

Streamline your work
As a real-life example, let’s take a look at a situation where some developers are debugging an issue that manifests as an alert for a high CPU issue on a server and is suspected to be a code issue. We start with the newly created Dynatrace Problems app, where we get problem alerts and first impressions from existing logs that are embedded in the Problems app. (Alternatively, we could start our analysis of this high CPU issue in the Services or Logs app.) Upon realizing there is a need for code-level data, we follow the link to Live Debugger to debug the code. Using Live Debugger, we immediately get insights into the running code, including variable values, process and thread information, and even a trace ID for the captured transaction.
Using the trace ID, we can inspect the captured trace directly in the Dynatrace Tracing app, giving us a full view of the end-to-end transaction as it flows through our systems. From there, any service or process can be selected to get more details on the CPU, memory, or running threads for that service, giving insight into low-level details of what is potentially the root cause of the issue.
For a detailed explanation of this example and walkthrough, visit our blog post, Debug complex performance issues in production.
Flatten the learning curve
Dynatrace allows central and platform engineering teams to easily provide curated access to the most critical Dynatrace use cases, ensuring a minimal impact on processes and reduced cognitive load on development teams.
Tailor-made entry points can be achieved using the aforementioned IDE plugins or by extending the Backstage developer portal with the Dynatrace plugin. Additionally, Dynatrace Launchpad offers an easy-to-use, configurable launch page. Follow the guidance provided in our documentation to ensure a quick start.
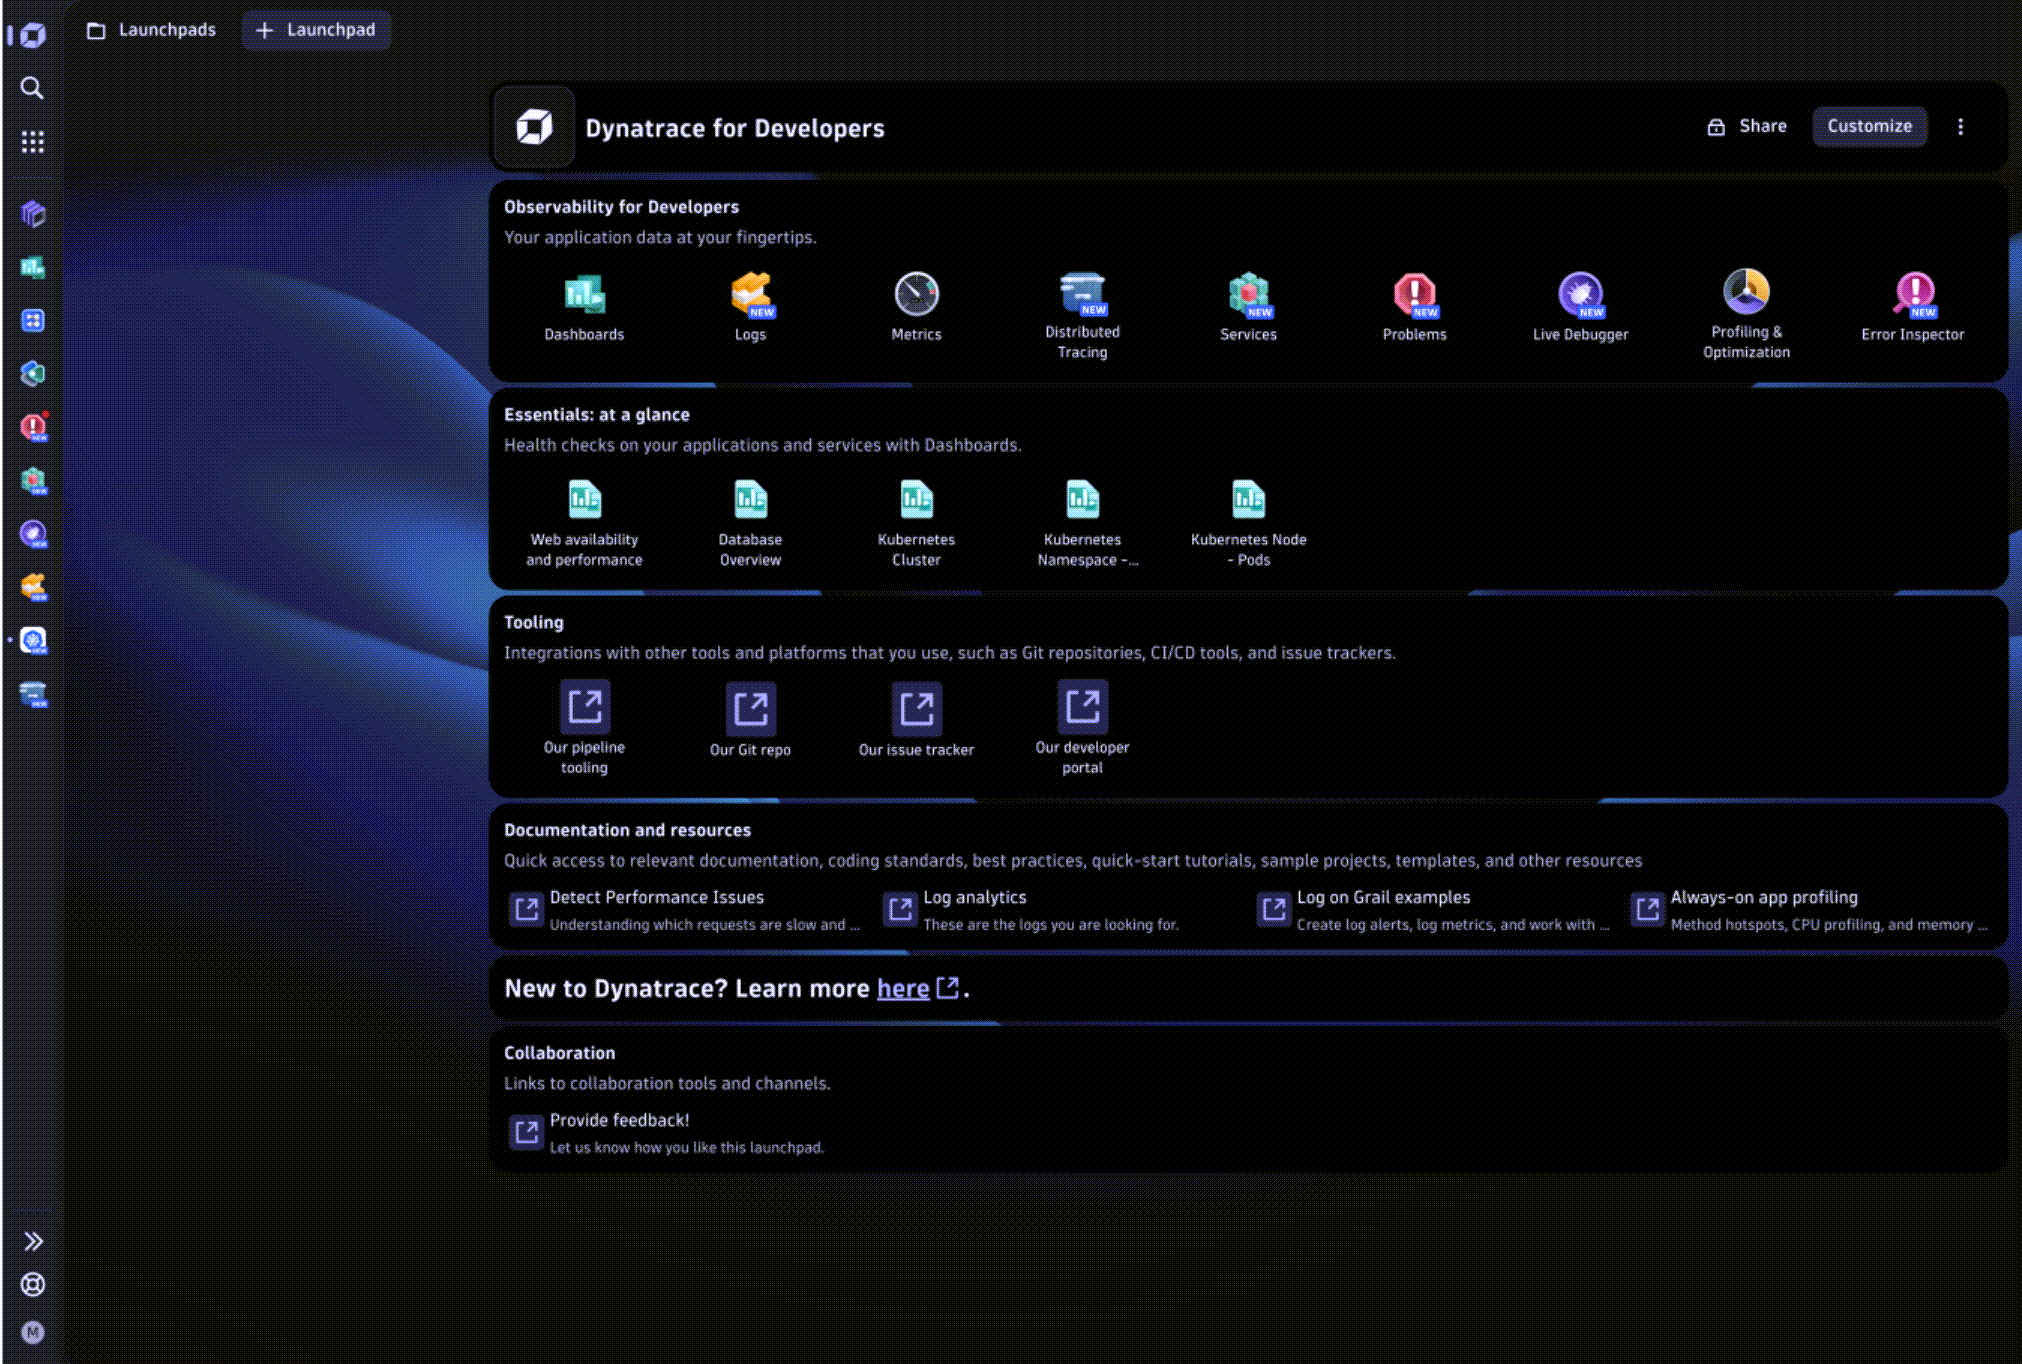 An example launchpad for developer audiences
Summary
It doesn’t matter if you shift left to fix bugs early in your Software Development Life Cycle or shift right to ensure code quality, testing, and release of a new feature.
Enhance your developers’ experience with analytics and automation throughout the software delivery process. This will allow them to understand exactly what’s happening in their code at any given moment, wherever it’s running, from Dev to Production and from bare metal to Kubernetes.
Observability for Developers is generally available except for Traces powered by Grail and Live Debugger, which are currently in preview and will be generally available within the next 90 days.