This post demonstrates how AWS DevOps Agent diagnoses Amazon Elastic Kubernetes Service (Amazon EKS) API server performance degradation, specifically 429 throttling and API Priority and Fairness (APF) seat exhaustion. A realistic simulation introduces a misbehaving controller that floods the API server with excessive requests. AWS DevOps Agent then autonomously identifies the offending workload, correlates Amazon CloudWatch audit logs with throttling patterns, and recommends targeted remediation to restore cluster stability.
Managing production incidents in Amazon EKS environments presents unique challenges for DevOps and site reliability engineering (SRE) teams. When incidents occur, on-call engineers must simultaneously investigate root causes across distributed systems while providing timely updates to stakeholders. This process often involves correlating data from multiple observability sources, examining recent deployment changes, and orchestrating cross-functional response teams, frequently outside normal business hours.
What is AWS DevOps Agent?
AWS DevOps Agent is an AI-powered operations assistant that autonomously investigates incidents, correlates signals across your infrastructure, and delivers actionable root cause analysis with recommended remediations. For a full overview, see the launch announcement. For Amazon EKS environments, the agent extends the following capabilities:
Key capabilities for EKS environments:
- Autonomous incident investigation: Automatically begins investigating incidents when alerts are triggered, reducing Mean Time to Resolution (MTTR).
- EKS-specific insights: Direct integration with Amazon EKS clusters for introspection of cluster states, pod logs, and cluster events.
- Amazon CloudWatch log analysis: Queries Amazon CloudWatch Logs Insights to analyze EKS audit logs, identifying throttled requests and the workloads responsible.
- Multi-tool integration: Connects with observability tools, continuous integration and continuous delivery (CI/CD) pipelines, and communication platforms for comprehensive data correlation.
- Proactive recommendations: Analyzes historical incidents and traffic patterns to deliver actionable recommendations for infrastructure optimization and application resilience.
Infrastructure setup
Prerequisites
Install the latest version of the AWS Command Line Interface (AWS CLI), eksctl, and kubectl. Please refer to installation steps.
Clone the repository
Clone the git repo https://github.com/aws-samples/sample-troubleshooting-eks-with-devops-agent to create the EKS cluster and recreate the control plane performance scenarios.
Provision an EKS Auto Mode cluster
Create an EKS Auto Mode cluster by applying the eks-auto-mode-cluster.yaml manifest. Make sure you’re in the downloaded repository directory before executing, as shown in the following command.
This manifest allows EKS Control Plane to log and deploy the CloudWatch Observability add-on alongside the cluster. Create a dedicated cluster for this performance testing to isolate your workloads and avoid unintended impact on existing EKS environments.
Configure AWS DevOps Agent
- Configure an AWS DevOps Agent space following the steps mentioned in AWS DevOps Agent helps you accelerate incident response and improve system reliability (preview) | Amazon Web Services
- To enable the agent to triage and analyze issues in your EKS cluster, create an EKS Access Entry using the same AWS DevOps Agent role configured in the Agent Space. Select “Standard” as the type and “AmazonAIOpsAssistantPolicy” as the Access Policy when creating the access entry. Create access entries – Amazon EKS
You can also use the following command to create the EKS Access Entry and associate it with the AWS DevOps Agent role.
Note: Replace the principal-arn, using your AWS DevOps Agent primary IAM role ARN, which you can find when you choose to edit “Primary source – required” in the Agent Space under Capabilities.
Scenario: Diagnosing API server overload and 429 throttling
The challenge
API server performance degradation is one of the most difficult Kubernetes issues to diagnose. Unlike pod failures or node issues that produce clear error signals, API server overload manifests as subtle latency increases across cluster operations. kubectl commands slow down, deployments take longer, and controller reconciliation loops fall behind, but there may not be any obvious pod crashes or node failures to point to.
The root cause typically involves a misbehaving controller or workload that floods the API server with excessive requests. Kubernetes manages this load through APF, a system that limits how many requests can be processed simultaneously while each active request occupies what is called a concurrency seat. When APF seats are exhausted, the API server returns 429 (Too Many Requests) responses. These 429s are particularly insidious because:
- They often retry transparently by client-go, so the offending workload may not even log them.
- They appear in the EKS audit logs but not in standard application logs.
- They cause throttling of legitimate system controllers, such as Karpenter and other EKS controllers.
- The latency impact is cluster-wide, making it hard to isolate the source.
Engineers typically spend hours manually querying CloudWatch Logs Insights, examining API server metrics, and correlating request patterns across multiple workloads before identifying the root cause. This is exactly the kind of multi-signal investigation that AWS DevOps Agent excels at.
How the simulation works
We will deploy a “controller”, a Python async application that simulates a misbehaving Kubernetes controller flooding the API server with a configurable mix of API calls.
The mix of call types is important. LIST and GET calls are fast, but high-volume. WATCH calls are especially effective at consuming APF seats because they hold connections open. MUTATE calls to exercise the separate mutating APF flow schema. Together, they saturate both read and write concurrency paths.
At 50 replicas with ~80-100 actual requests per second each, the total load of ~1600-2000 req/s produces:
- Visible API server latency (~1.5s+ for basic kubectl commands vs ~100 ms baseline).
- 429 throttling responses visible in CloudWatch audit logs.
- 429s on system controllers (Karpenter, EKS controllers).
Scenario preparation
- Deploy the controller using the following kubectl command
# Set your EKS cluster's region export AWS_REGION=us-east-1 kubectl apply -f ./blog-troubleshooting-eks-with-devops-agent/manifests/controller-deployment.yaml
This creates the agent-demo namespace, role-based access control (RBAC) resources, the controller deployment (disabled).
- Capture a baseline from the EKS Observability dashboard.In the EKS console, navigate to Observability → Monitor cluster → Control plane monitoring and take a screenshot or note the current values for the API server latency and request-rate metrics. This is your baseline.
- Verify baseline API server responsiveness:
kubectl apply -f ./blog-troubleshooting-eks-with-devops-agent/manifests/measure-job.yaml # Wait for containers to start kubectl logs job/api-measure -n agent-demo
- Inject the fault:
kubectl apply -f ./blog-troubleshooting-eks-with-devops-agent/manifests/inject-fault.yaml
This manifest scales the controller to 50 replicas and allows the mixed call load.
What you may see, and why it’s fine. The controller pods themselves can briefly enter CrashLoopBackOff or be OOM-terminated during the ramp-up as they each open their connection pools and start hammering the API server. You may also see a transient node-unhealthy indicator in the EKS console, and individual pod restarts. This is the workload destabilizing itself under its own load, not a cluster-wide failure. The cluster as a whole stays up. Both indicators clear automatically after the controller stabilizes the load level we are simulating, and they do not affect the diagnostic value of the scenario.
- Wait ~60 seconds for load to build, then re-check the EKS Observability dashboard.
Refresh Observability → Monitor cluster → Control plane monitoring. You should see the following:- API server request latency spiking well above the baseline, typically into the multi-second range.
- API server requests per second climbing to ~1,600–2,000.
- APF rejected requests (429s) appearing where there were none at baseline.
This measurement stays reliable even when kubectl is slow because we’re pulling these numbers directly from the control plane’s metric pipeline, not from a workload within the cluster.
Optional: confirm the user-visible impact.
Run a few kubectl commands from your workstation to experience the latency from a client perspective.
time kubectl get pods -n agent-demo time kubectl get nodesWait 60 seconds for loads to build, then observe the impact:
Expected: kubectl commands now take more than ~1.5 seconds, a noticeable degradation.
- Verify cluster health nodes and pods are unaffected mostly:
kubectl get nodes kubectl get pods -A | head -20
In this scenario, the issue manifests primarily as API server latency spikes and HTTP 429 throttling. You may also observe pod restarts and a transient node-unhealthy indicator in the EKS console. These are secondary symptoms caused by the control plane being overwhelmed, not independent of compute or workload failures. This distinction matters because traditional Kubernetes troubleshooting instincts push engineers to investigate node health and pod crashes first. That focus can delay root cause identification when the underlying problem is API server degradation.
You can observe this latency and 429 throttling metrics in the Amazon EKS console by navigating to Observability → Monitor Cluster → Control plane monitoring, as shown in the following image. The console surfaces that a problem exists and diagnoses why the API server is overwhelmed. Identifying the specific clients, request patterns, or resource types driving the performance issue remains a manual, time-consuming effort.
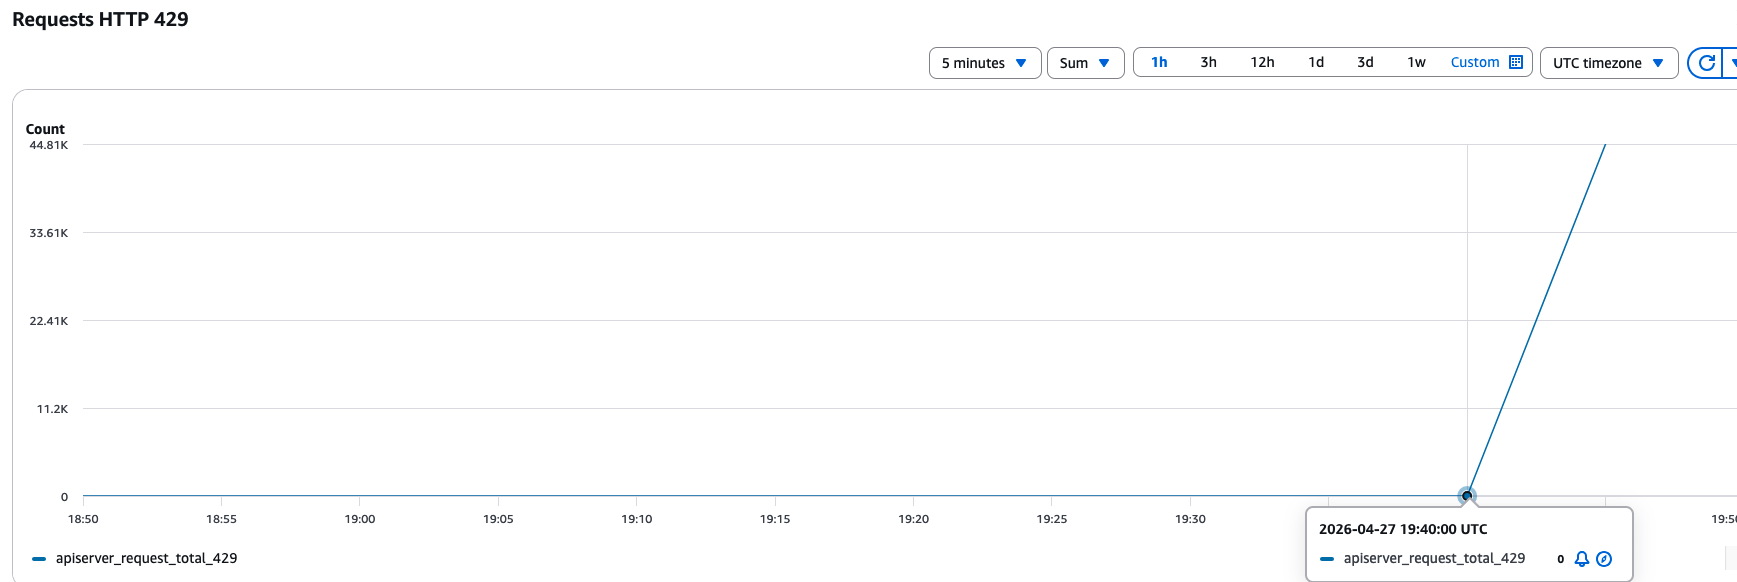
API Server Requests getting throttled with 429.
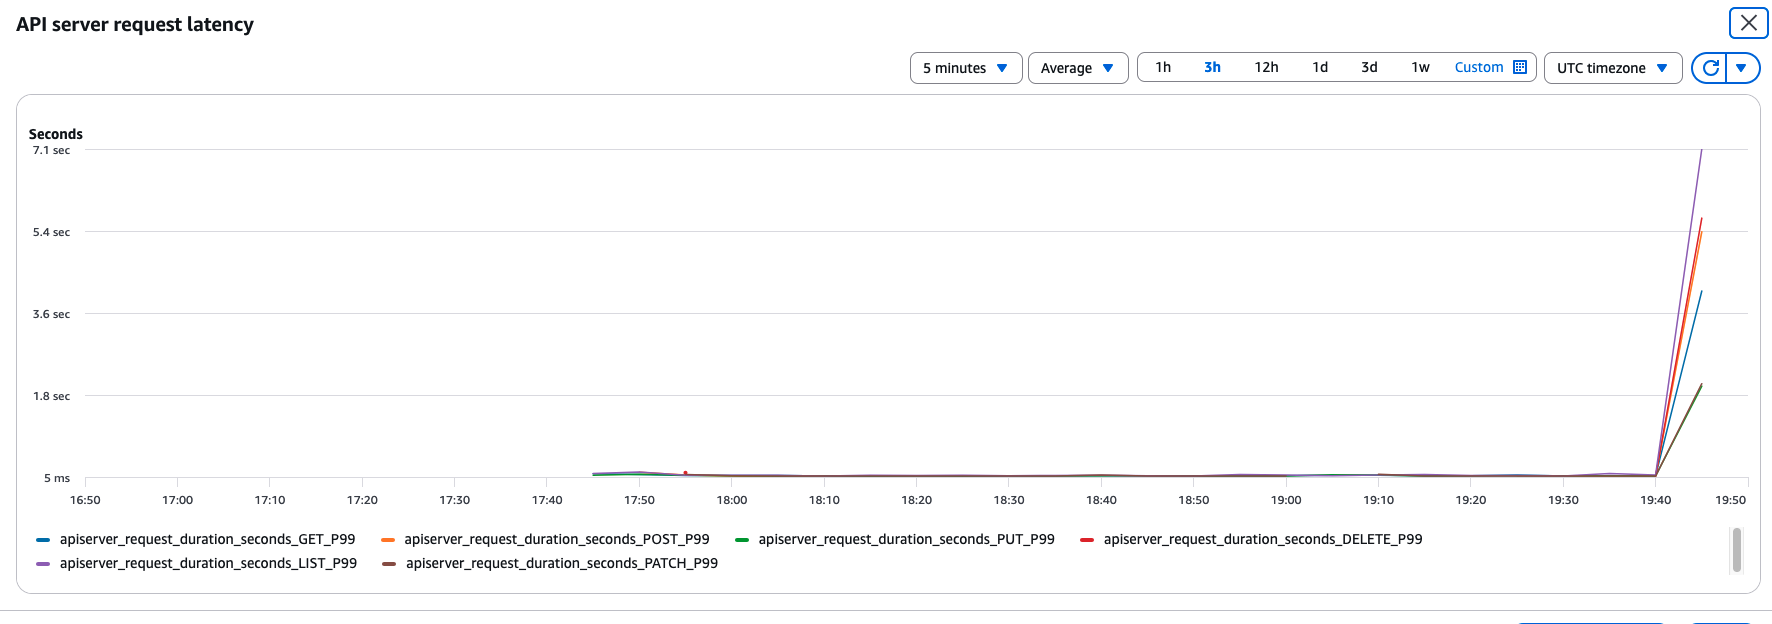
API Server Request Latency during load.
Troubleshooting with AWS DevOps Agent
Navigate to the AWS DevOps Agent Operator portal, select Incidents in the navigation pane, and submit the following diagnostic prompt in the Incident Response Dashboard → Start an investigation section.
Note: Use the chat interface for follow-up queries or to steer the investigation in a different direction after the initial analysis.
I’m experiencing slow API server responses on my EKS cluster devops in us-east-1 starting a few minutes ago. kubectl commands are taking longer than the usual sub-second response. Please investigate.
In the Investigation starting point, provide additional context, such as “this issue started a few minutes ago”.
Choose Start Investigation.
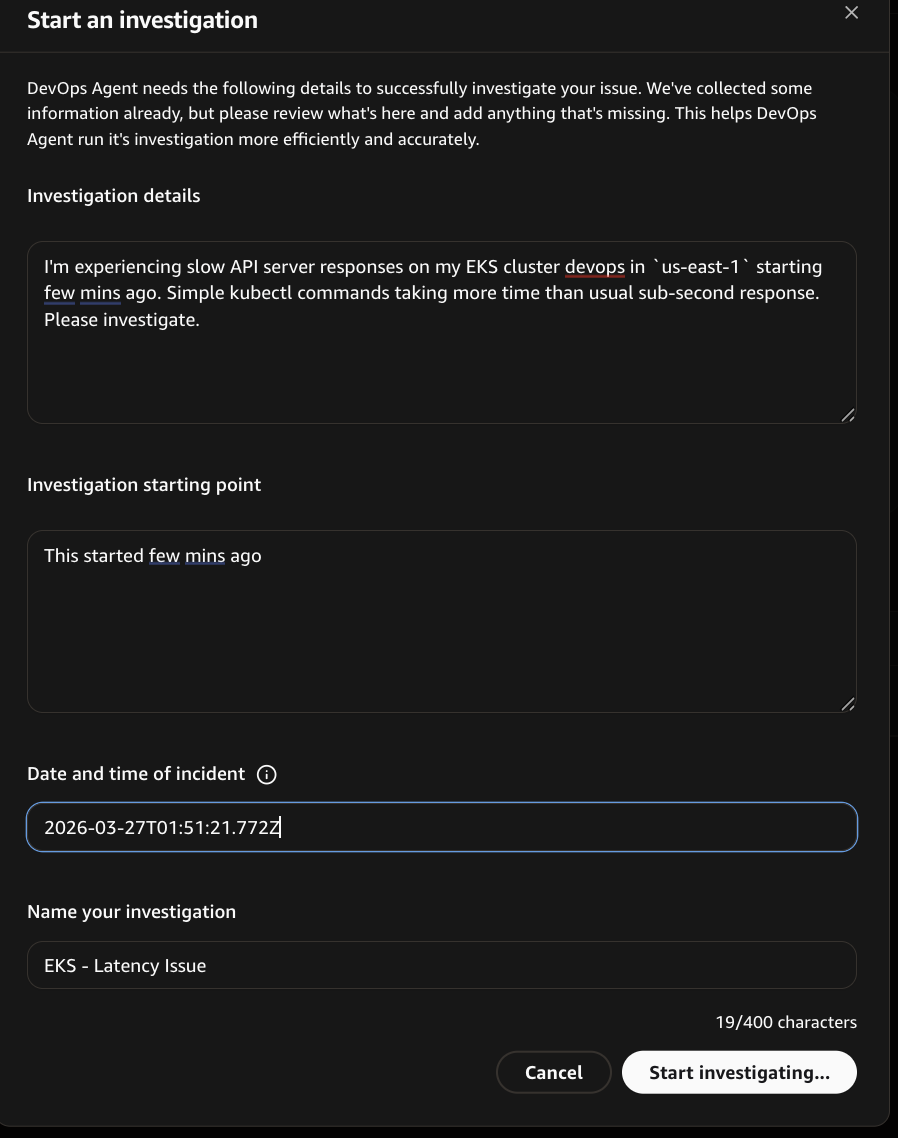
Start an investigation in DevOps Agent.
Note: The investigation findings presented in this section reflect the output generated by AWS DevOps Agent during our investigation. As with any AI-powered tool, results may vary between investigations because of differences in cluster state and available telemetry. Your experience may produce slightly different diagnostic paths while arriving at similar conclusions.
Once we initiated the investigation, the agent begins by establishing the investigation timeline and gathering the EKS cluster context. It identified the EKS cluster “devops” and started the investigation.
The agent launched multi-signal investigation tasks simultaneously from various sources including EKS API metrics, control plane logs, AWS CloudTrail events, and cluster state for any changes.
- EKS API Metrics: Queried CloudWatch metrics for EKS API server performance details.
- Kubernetes Cluster State Analysis: Examined current state of the cluster, including the nodes, events, and pods.
- Control Plane Log Analysis: Searched for 429 throttling, error patterns, and audit log entries showing slow requests.
- Infrastructure Changes: Scanned CloudTrail for recent changes that could affect the EKS cluster, such as EKS API calls and EC2 instance changes.
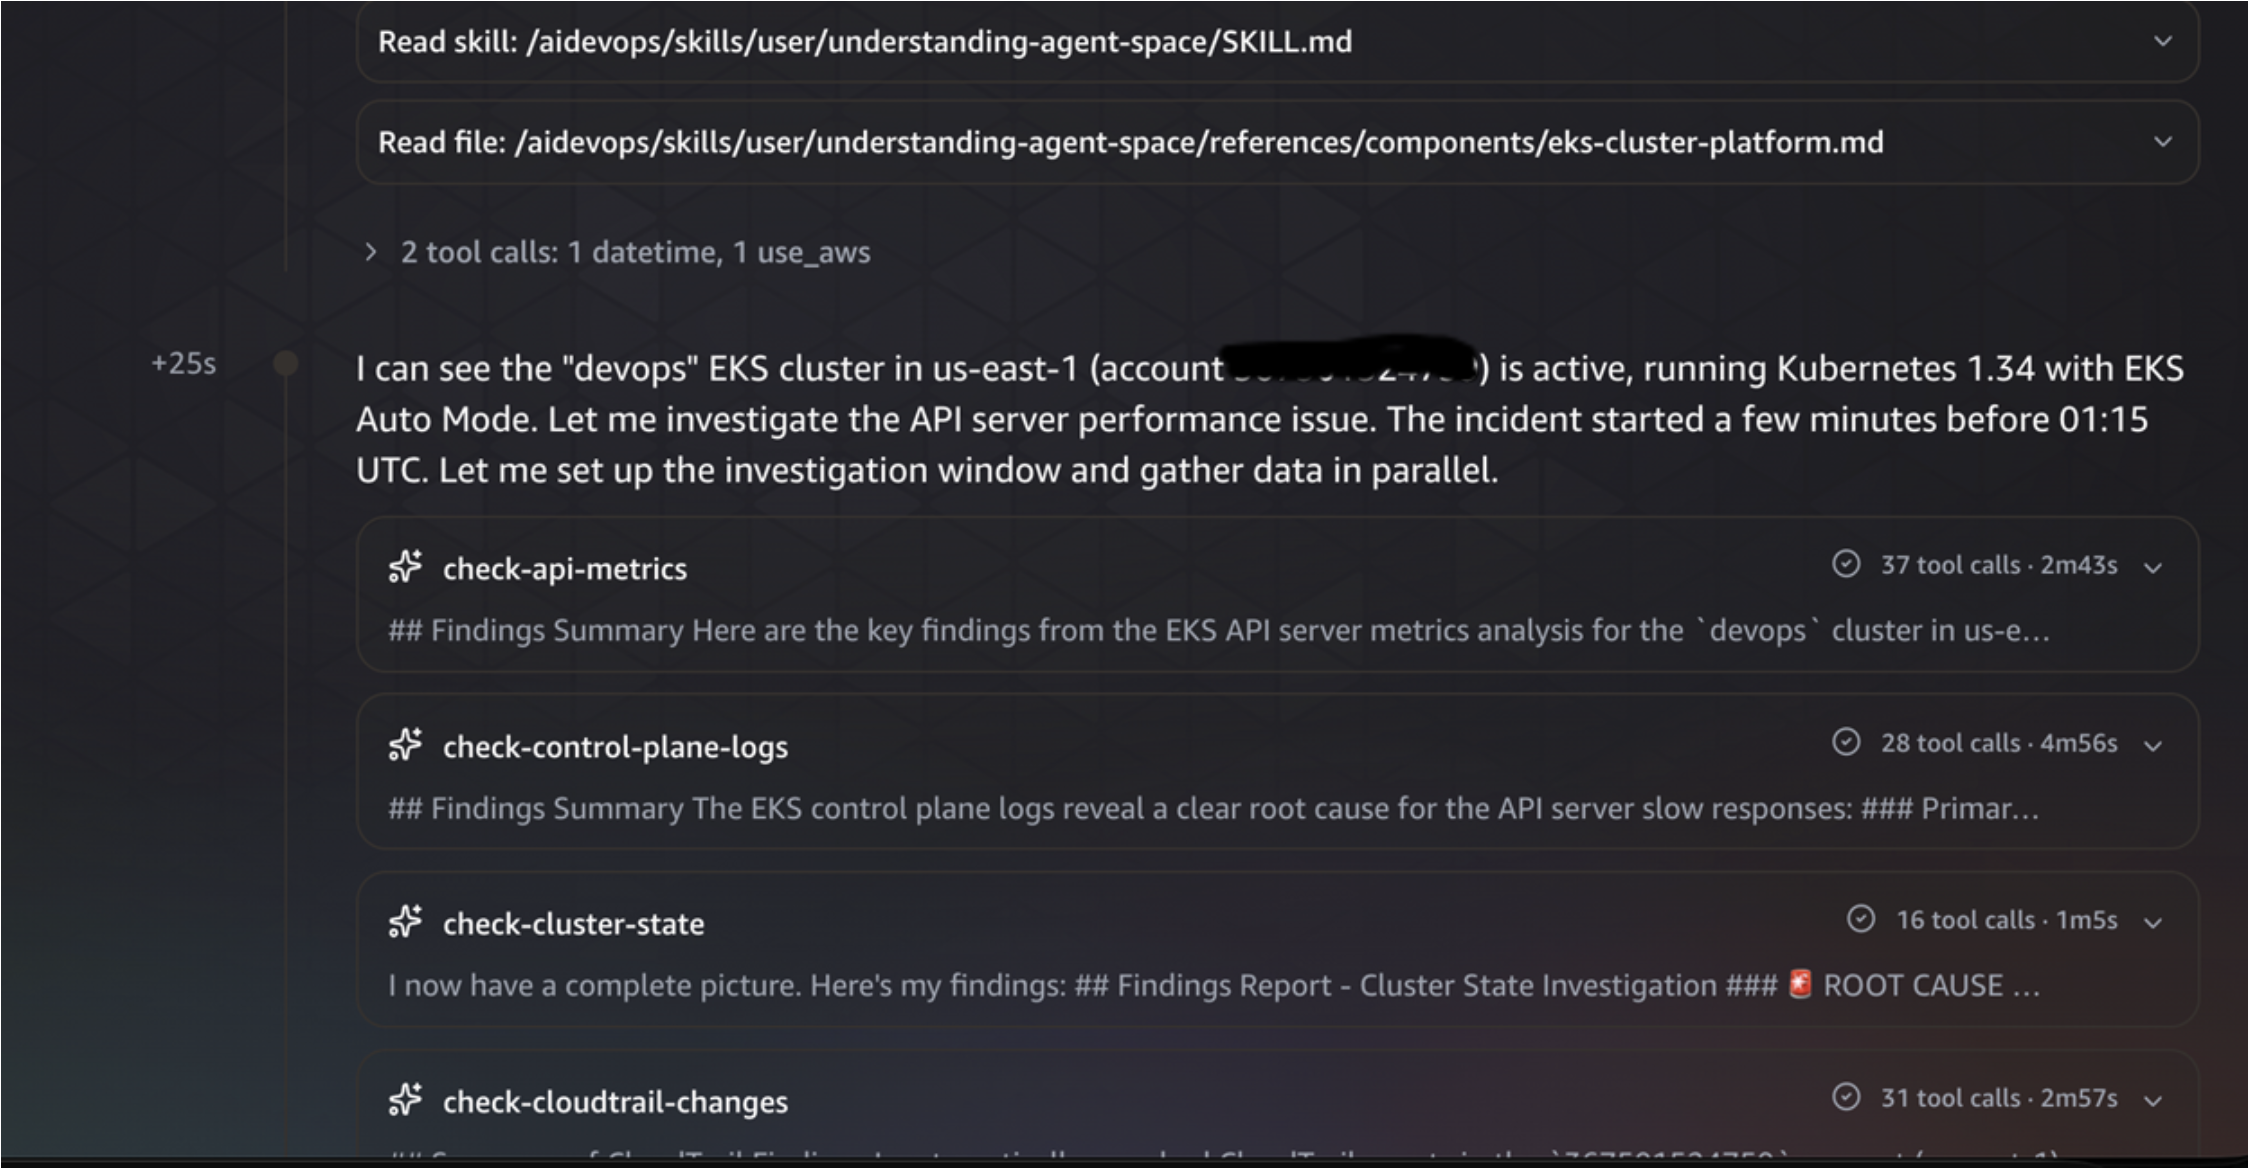
DevOps agent troubleshooting EKS Control Plane Issues.
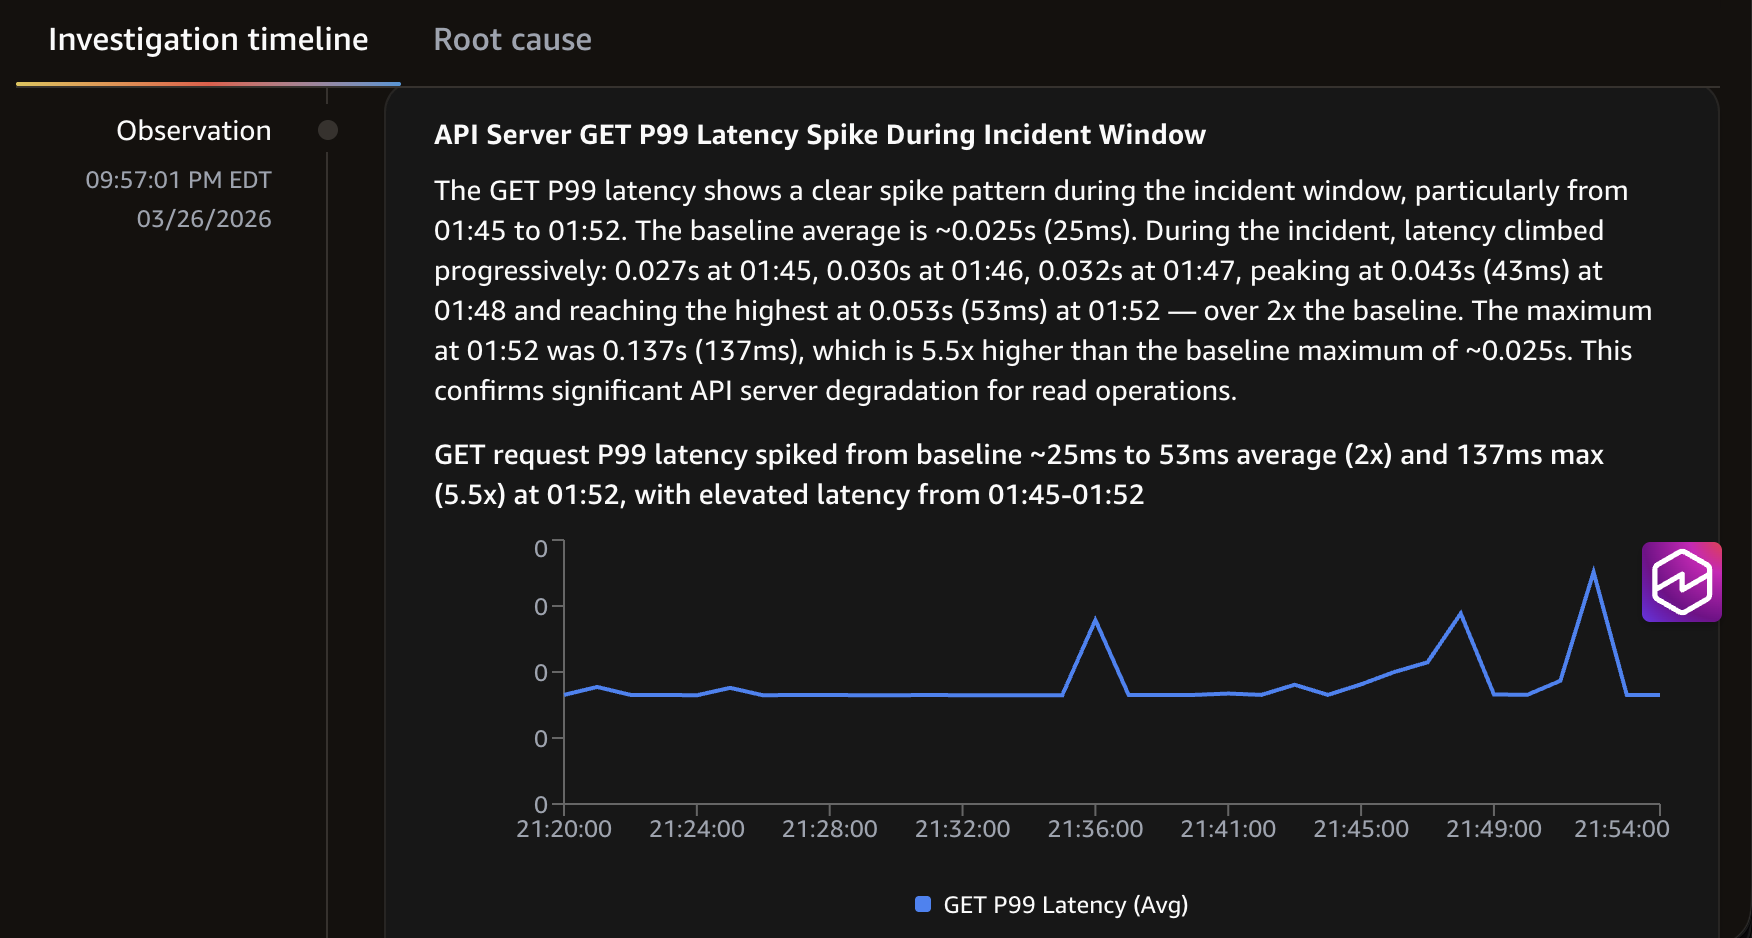
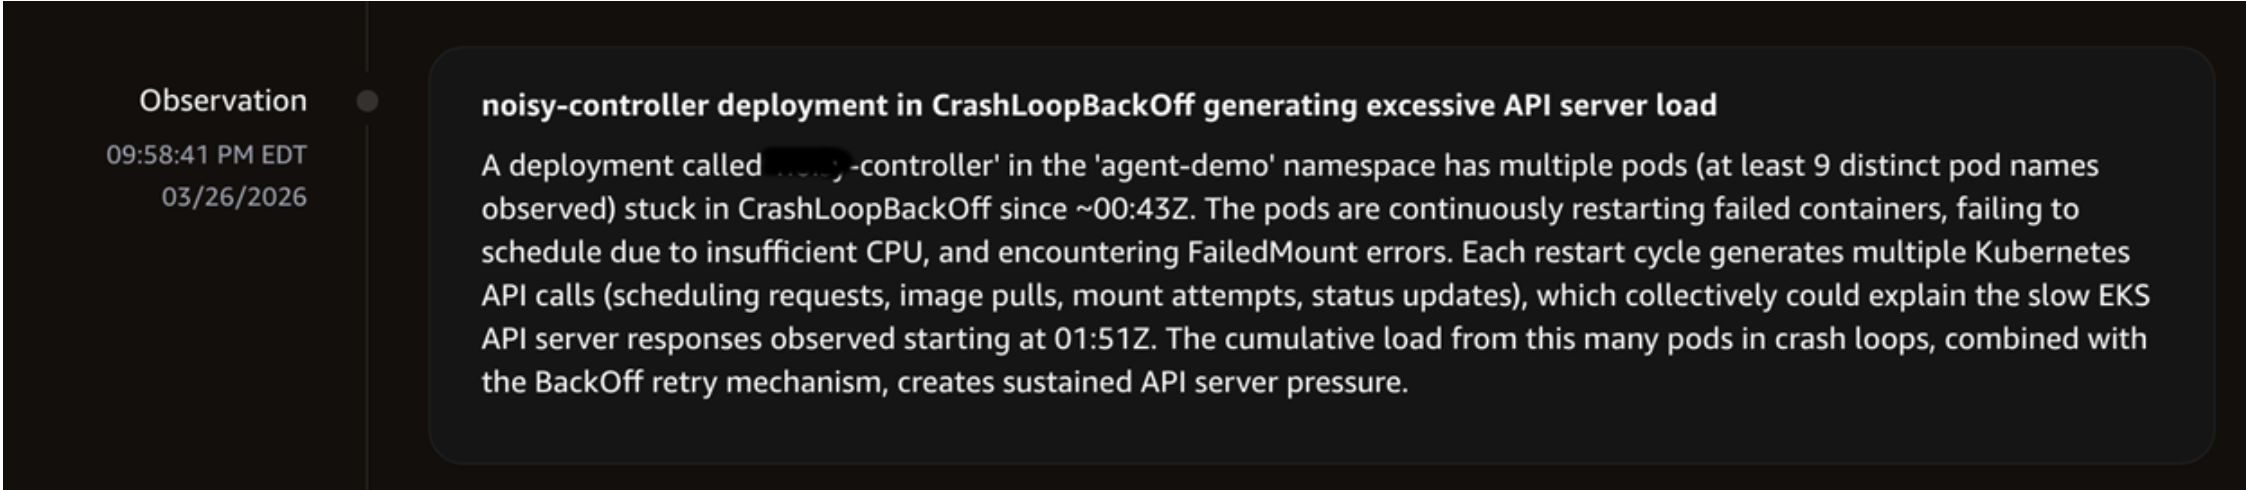
The agent queried CloudWatch Logs Insights and discovered the controller, which generated large numbers of API calls in the short duration of the incident, targeting the controller service account. This led to a clear spike in API server latency during the incident window.
DevOps agent identifying the root case.
DevOps agent identifying the root cause.
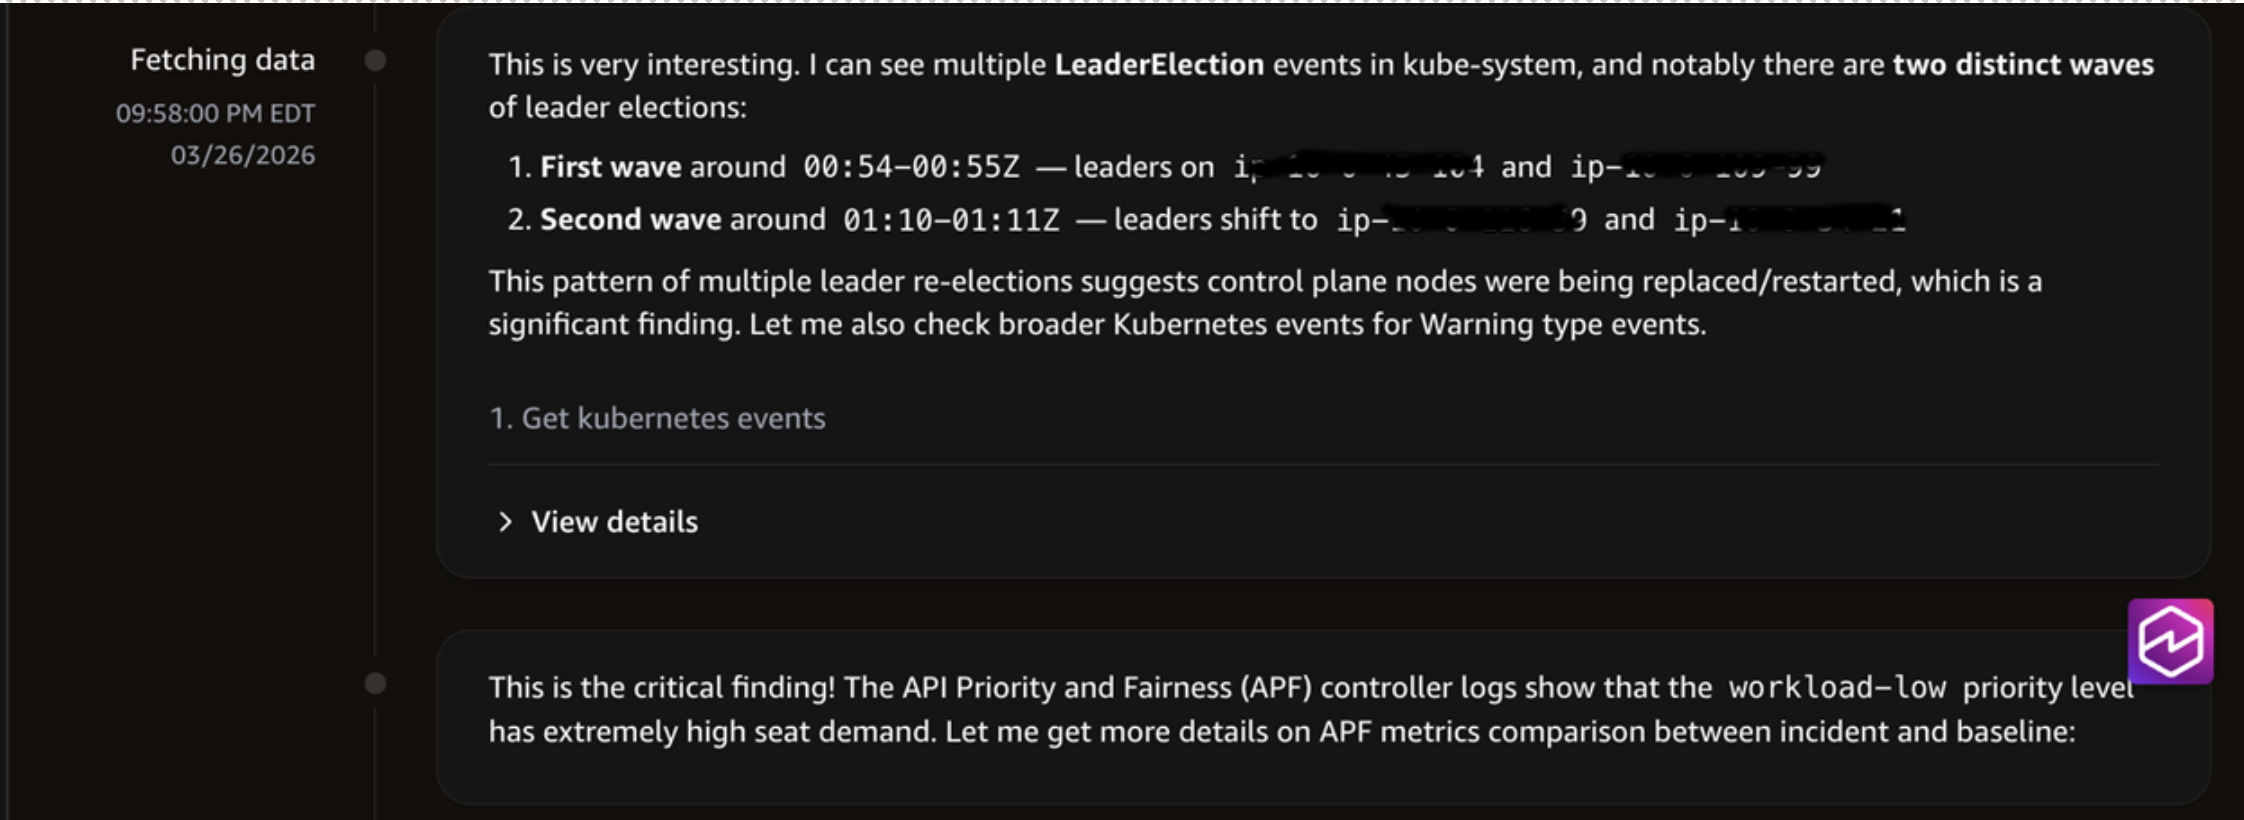
The agent also determined the critical finding of the API Priority and Fairness (APF) high seat demand and compared the metrics between the baseline and the incident period.
DevOps agent investigating EKS Issue.
DevOps Agent investigating the issue.
The agent compared the baseline vs incident API patterns and discovered the critical behavioral change: during baseline, the API server has primarily LIST operations. But during the incident window, it added CREATE/DELETE configmap mutations, WATCH operations, and GET operations as well, which were not present in the baseline.
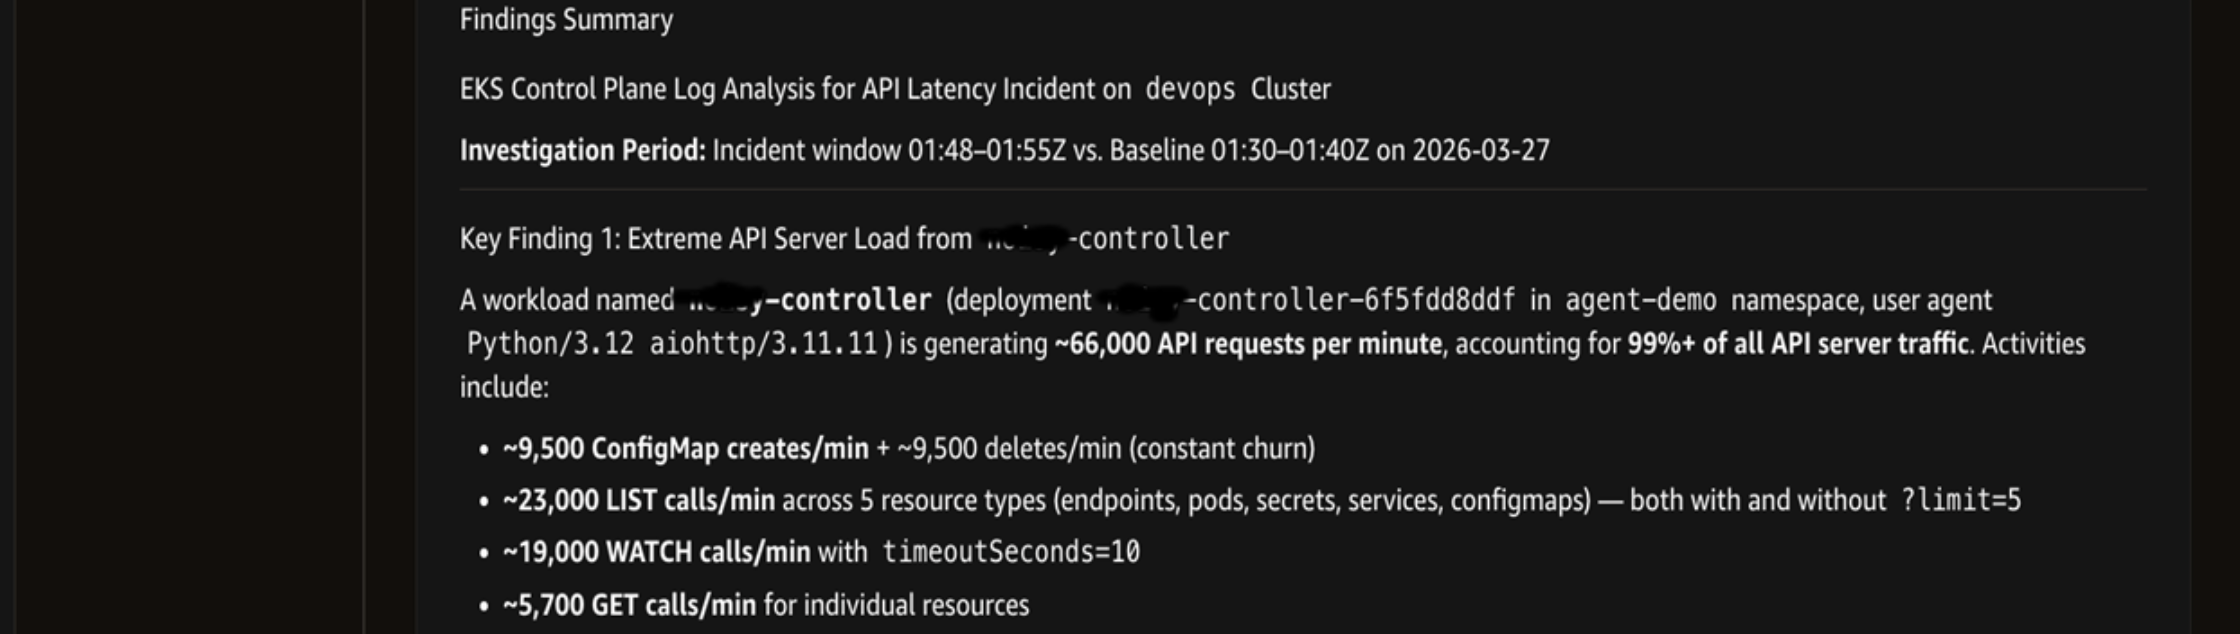
Investigation showing the findings summary.
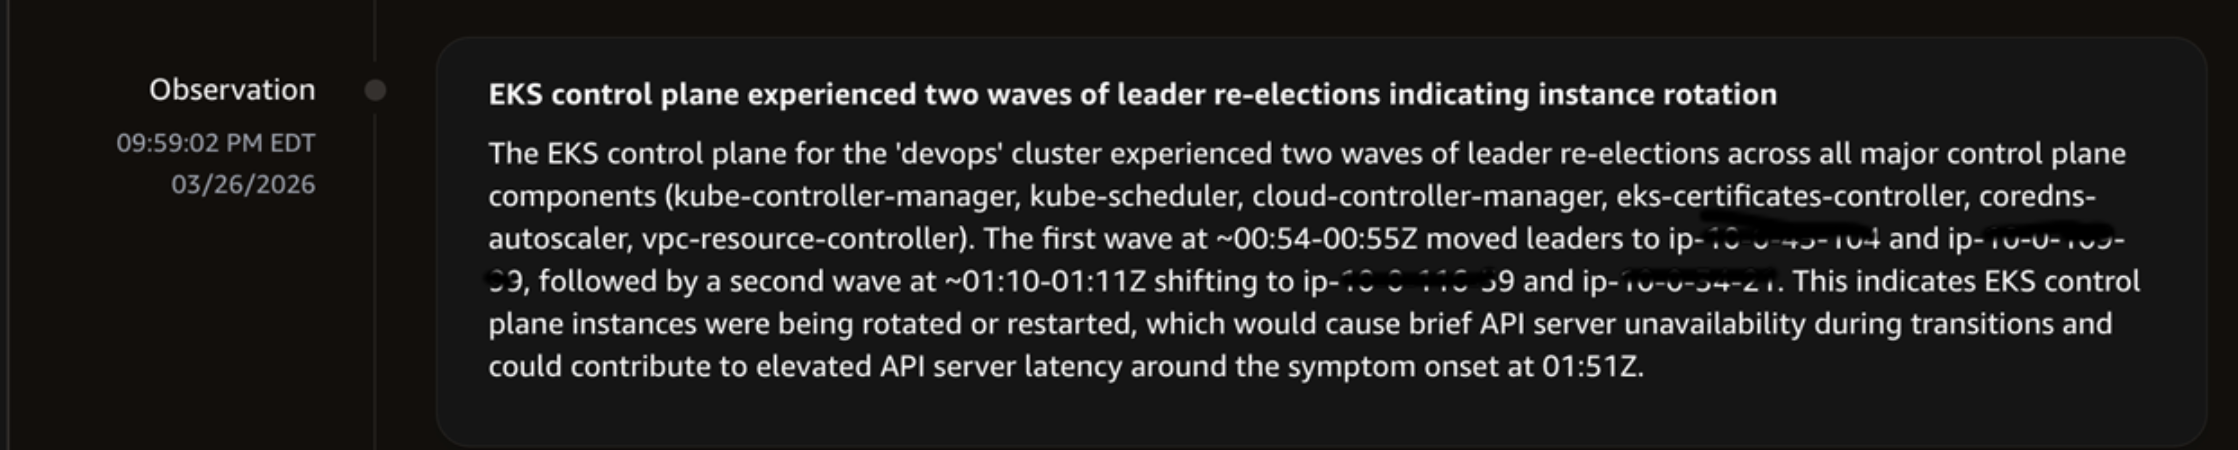
The agent determined that there were no changes to the EKS cluster configuration, security group rule, AWS Identity and Access Management (IAM) role or policy, and network configuration. It also finalized the investigation summary that the incident was caused by the controller deployment, which led to API Priority and Fairness ‘workload-low’ priority level concurrency saturation and EKS control plane instance rotation.
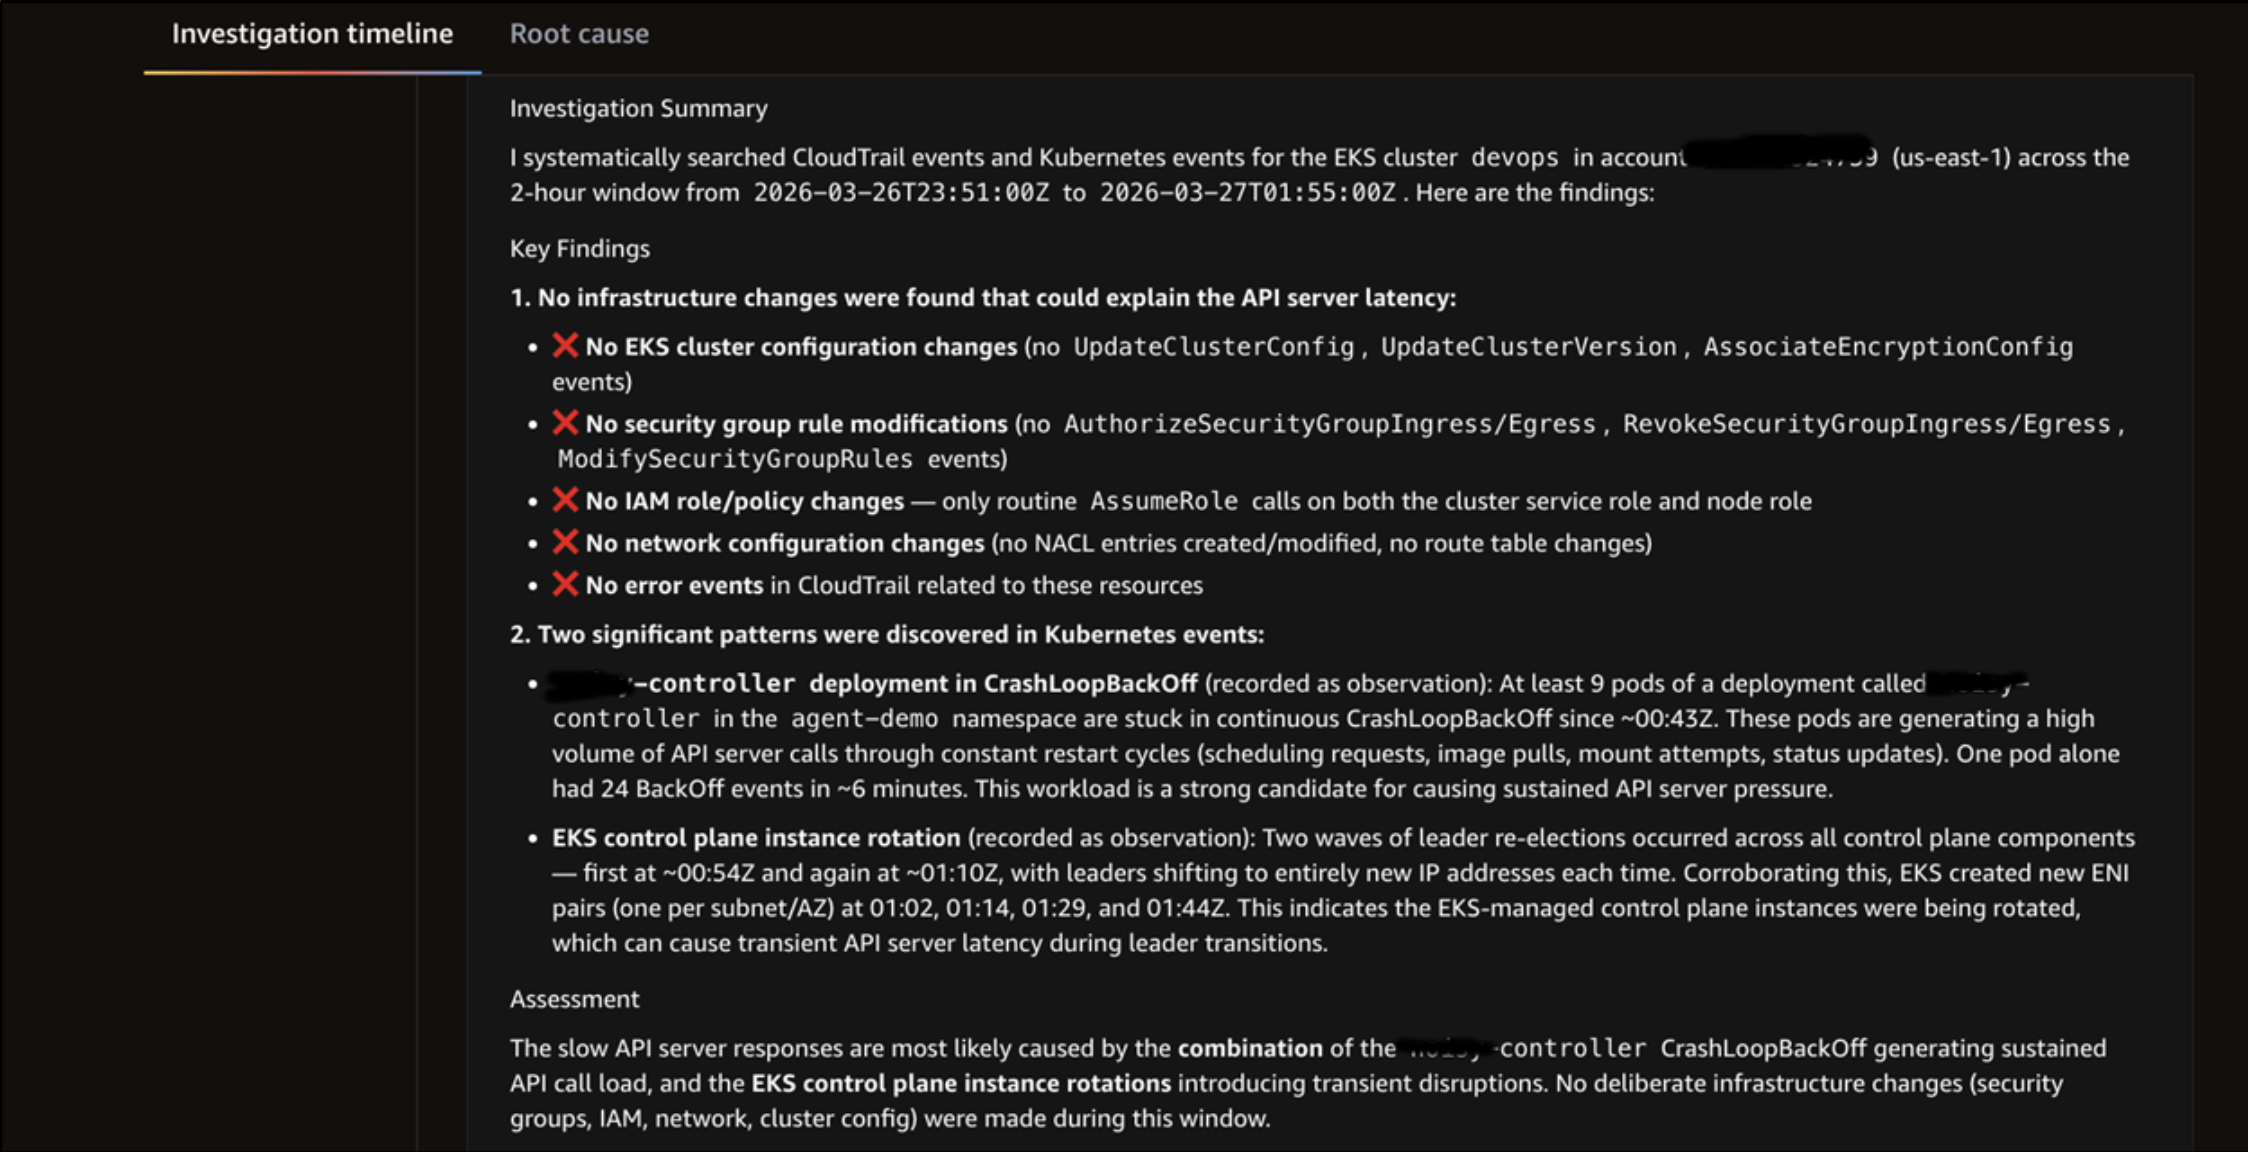
Investigation showing findings summary.
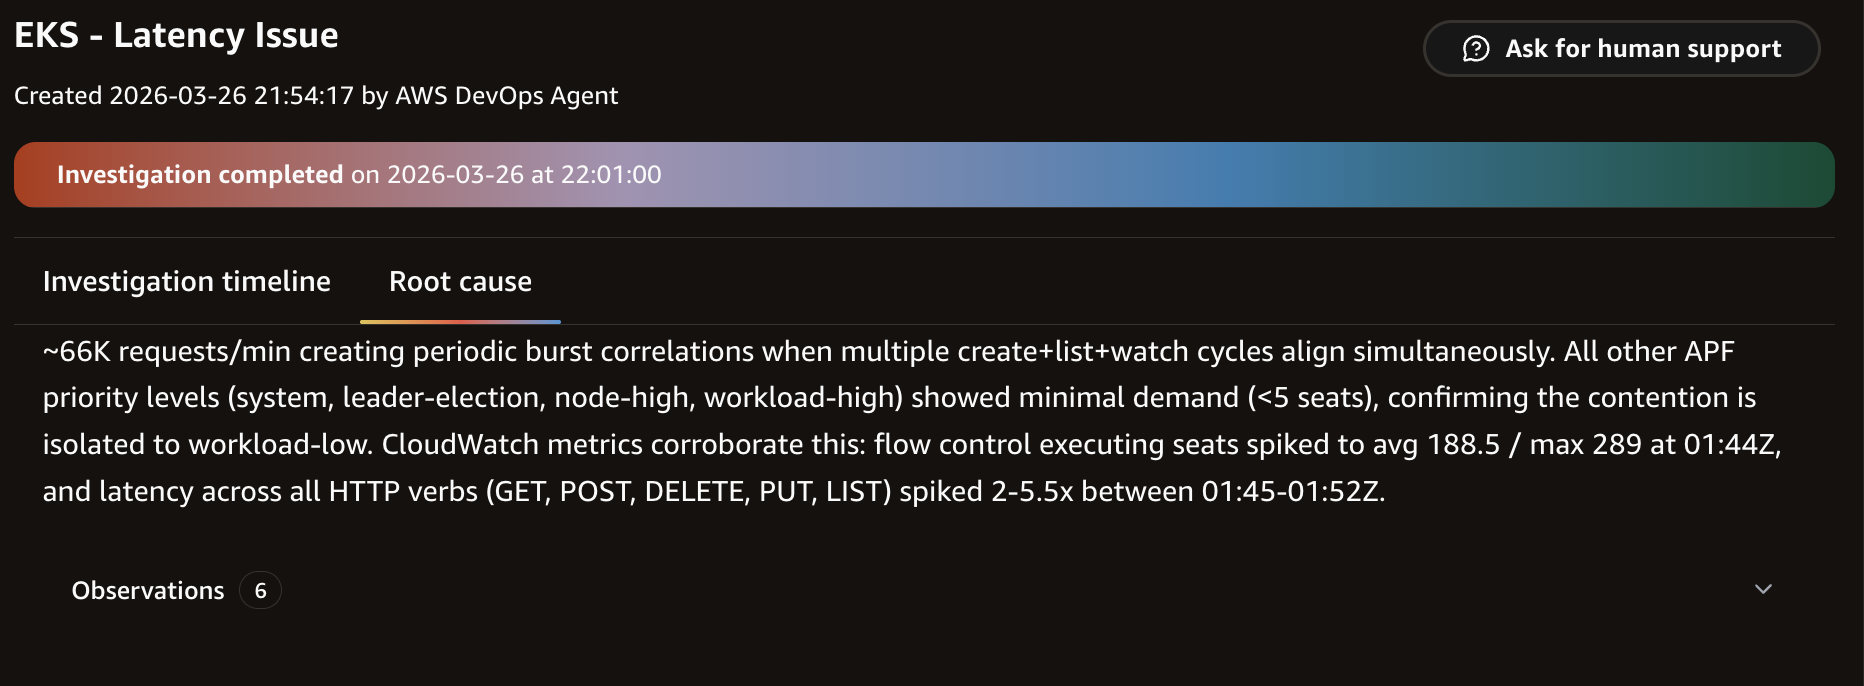
Finally, for the root cause determination, the agent synthesized signals from multiple sources into a definitive root cause and surfaced with a Root Cause button. Selecting the button navigates to the Root Cause tab, which consolidated the findings from the investigation into a single, actionable summary.
DevOps Agent summarizing key findings.
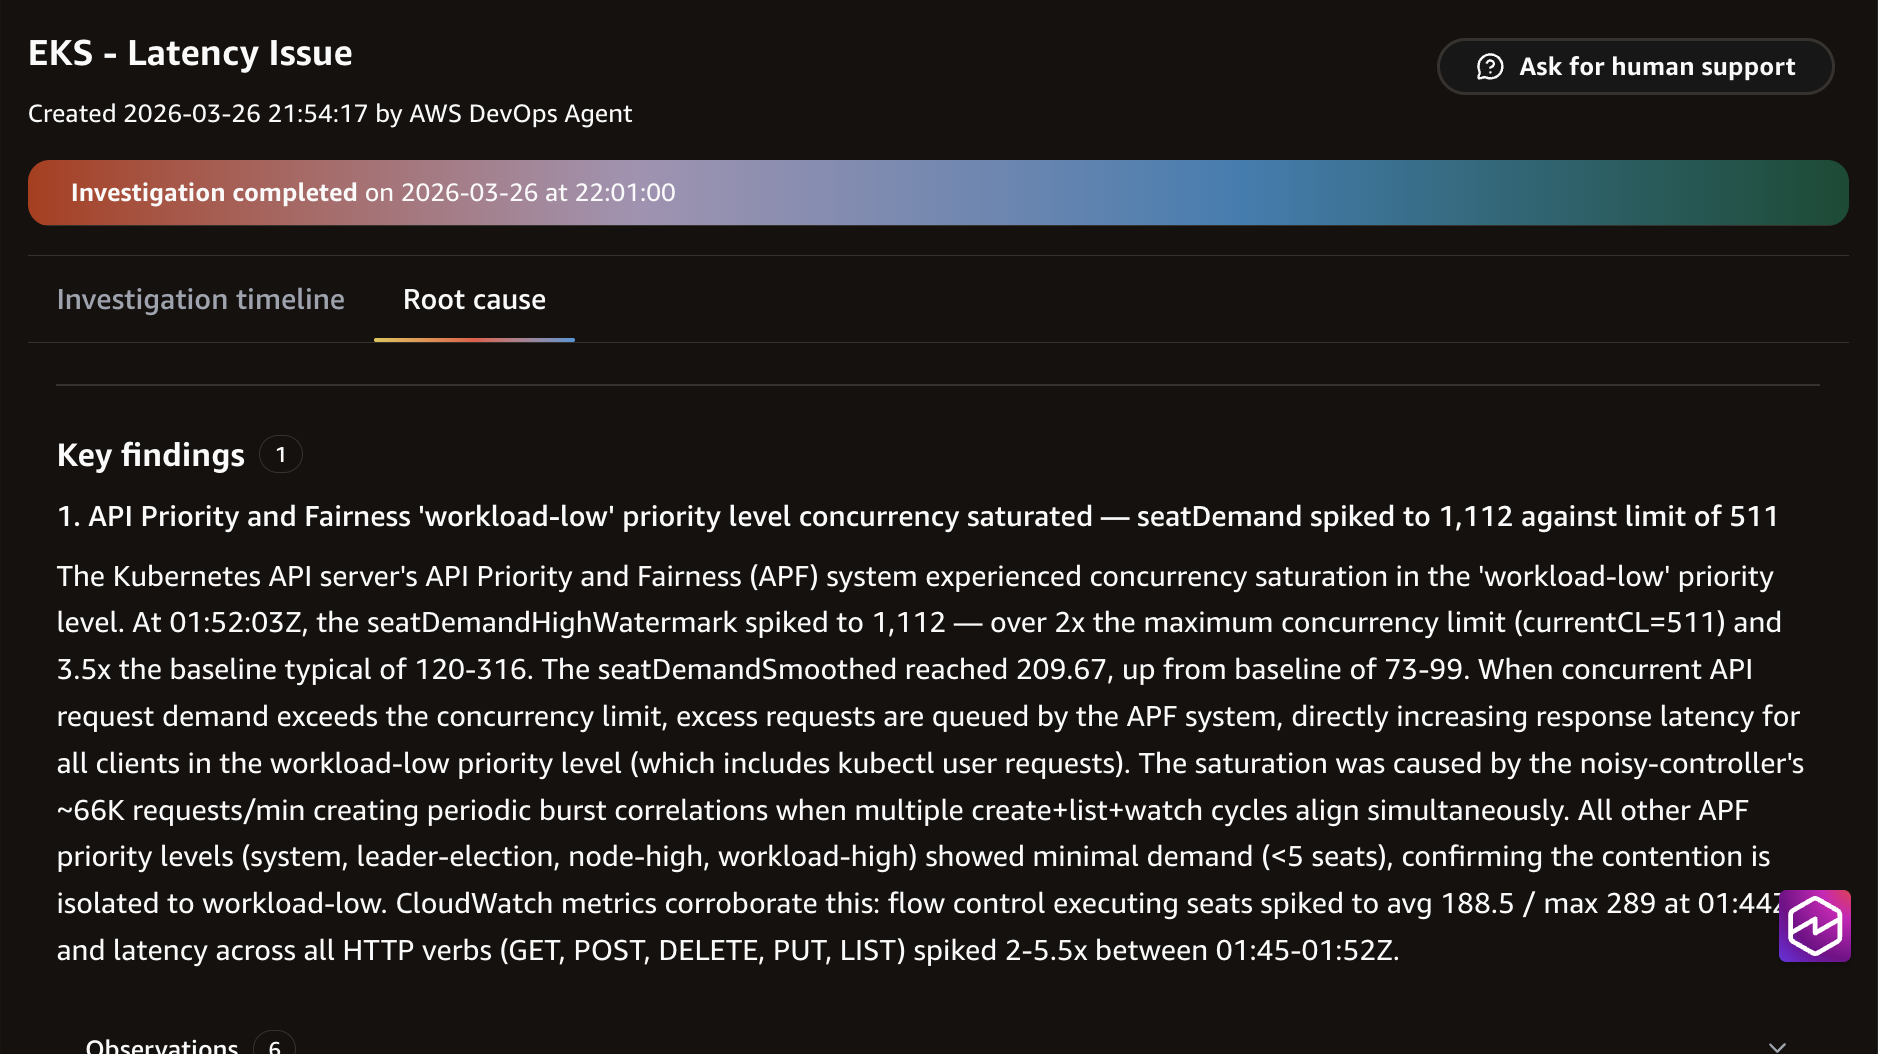
DevOps Agent showing findings summary.
The agent concluded:
Root Cause: ‘controller’ deployment generated approximately 66,000 API requests per minute to the EKS API server for cluster ‘devops’. This sustained load consumes 99%+ of API server traffic, impacting the API server’s performance.
In this scenario, the agent completed the investigation for us in approximately 7 minutes, from the initial prompt through root cause identification and CloudTrail attribution. The agent correlated data from CloudWatch metrics, EKS audit logs, CloudTrail events, pod logs, and the cluster’s state to surface the root cause.
Recovery
Disable the controller and restore normal API server performance:
API server responsiveness returns to baseline within seconds. Confirm recovery using the same EKS Observability dashboard you used for the baseline measurement, so the before/after numbers are directly comparable:
- Open Amazon EKS console → devops cluster → Observability → Monitor cluster → Control plane monitoring.
- Confirm:
- API server request latency has dropped back toward the baseline range.
- API server requests per second have dropped from the peak (~1,600–2,000) back to baseline levels.
- APF rejected requests (429s) have returned to zero or near zero.
We deliberately use the same measurement source here that we used during fault injection, because the in-cluster measure-job approach can fail to deploy or report when the API server is throttled. The control plane dashboard works in both states.
You can also confirm at the client level if you wish:
Both should now return at roughly the baseline latency you observed before fault injection.
Disable the controller and restore normal API server performance:
API server responsiveness returns to baseline within seconds.
Cleanup
Remove all resources created for this scenario:
Deleting the EKS cluster
Deleting the AWS DevOps Agent space
The following command will list your agent spaces
Get the AgentSpaceId you’ve created for this from the preceding command output and replace the ID in the following command to delete the AWS DevOps Agent space.
Also, delete the IAM roles created for the AWS DevOps Agent space
Why this matters: The APF transparency problem
A key insight from this scenario is that API Priority and Fairness makes throttling partially invisible to application code. When the API server has performance issues, the following occurs:
- The APF layer returns a 429 response to the client.
- The Kubernetes client-go library (and many HTTP clients) automatically retries.
- The request eventually succeeds after a brief wait in the queue.
- The application sees a successful response, only slower.
This means the offending workload may show no 429 errors in its logs, even though the audit logs record hundreds of these. Engineers looking at application logs alone will miss the root cause entirely. The agent correlates multiple sources, including the EKS audit logs, which helps to find the root cause of the issue efficiently.
This pattern is common in production environments. A controller with a bug in its reconciliation loop, a CI/CD pipeline making excessive API calls, or a monitoring tool polling too aggressively can trigger this behavior. The agent’s ability to automatically query audit logs and correlate with metrics and events makes it uniquely effective at diagnosing these issues.
Improvements
AWS DevOps Agent not only accelerates incident resolution by autonomously investigating current issues but also analyzes historical incident data to provide recommendations that prevent recurring issues. By correlating operational telemetry with past incidents, the agent identifies emerging risk patterns and suggests preventive actions. Teams can address vulnerabilities proactively, reducing incident frequency and improving system availability.
To find the improvement details, navigate to the AWS DevOps Agent Operator portal and select Improvements in the navigation pane.
Conclusion
Kubernetes control plane performance issues represent one of the most challenging diagnostic scenarios for DevOps and SRE teams. The combination of subtle latency degradation, 429 retries, and multi-signal investigation requirements makes manual diagnosis time-consuming and error prone.
AWS DevOps Agent transforms this process by automatically correlating CloudWatch metrics, audit logs, cluster state, CloudTrail events and workload patterns to identify the root cause in minutes rather than hours. By pinpointing the specific workload, service account, and API call patterns responsible for the performance issues, the agent allows teams to take targeted remediation actions and implement preventive measures.
Organizations are adopting Kubernetes and containerized architectures at scale, and tools like AWS DevOps Agent help teams maintain operational excellence. We encourage you to explore how this service can transform your EKS incident response workflows and help you build more resilient applications.
You can use AWS DevOps Agent in multiple AWS Regions (see the launch announcement for details). Regardless of where the agent itself runs, it supports cross-region investigation capabilities, allowing you to monitor, diagnose, and troubleshoot resources deployed across multiple AWS Regions.
To get started:
- Create your first AWS DevOps Agent space
- Read the AWS DevOps Agent documentation
- Clone the sample code from this post
- Learn more about Amazon EKS observability