Use case example: Leverage Live Debugger, Open Pipeline, and OpenTelemetry to tackle a complex performance issue.
Use Case
In this example use case, we’re investigating a high CPU load issue in an application using OpenTelemetry. Dynatrace OpenPipeline™ is configured to ingest logs from our environment, including the AdService example service. Upon detecting a high CPU load, Davis® AI generates a problem event and populates it with a direct link to Live Debugger.
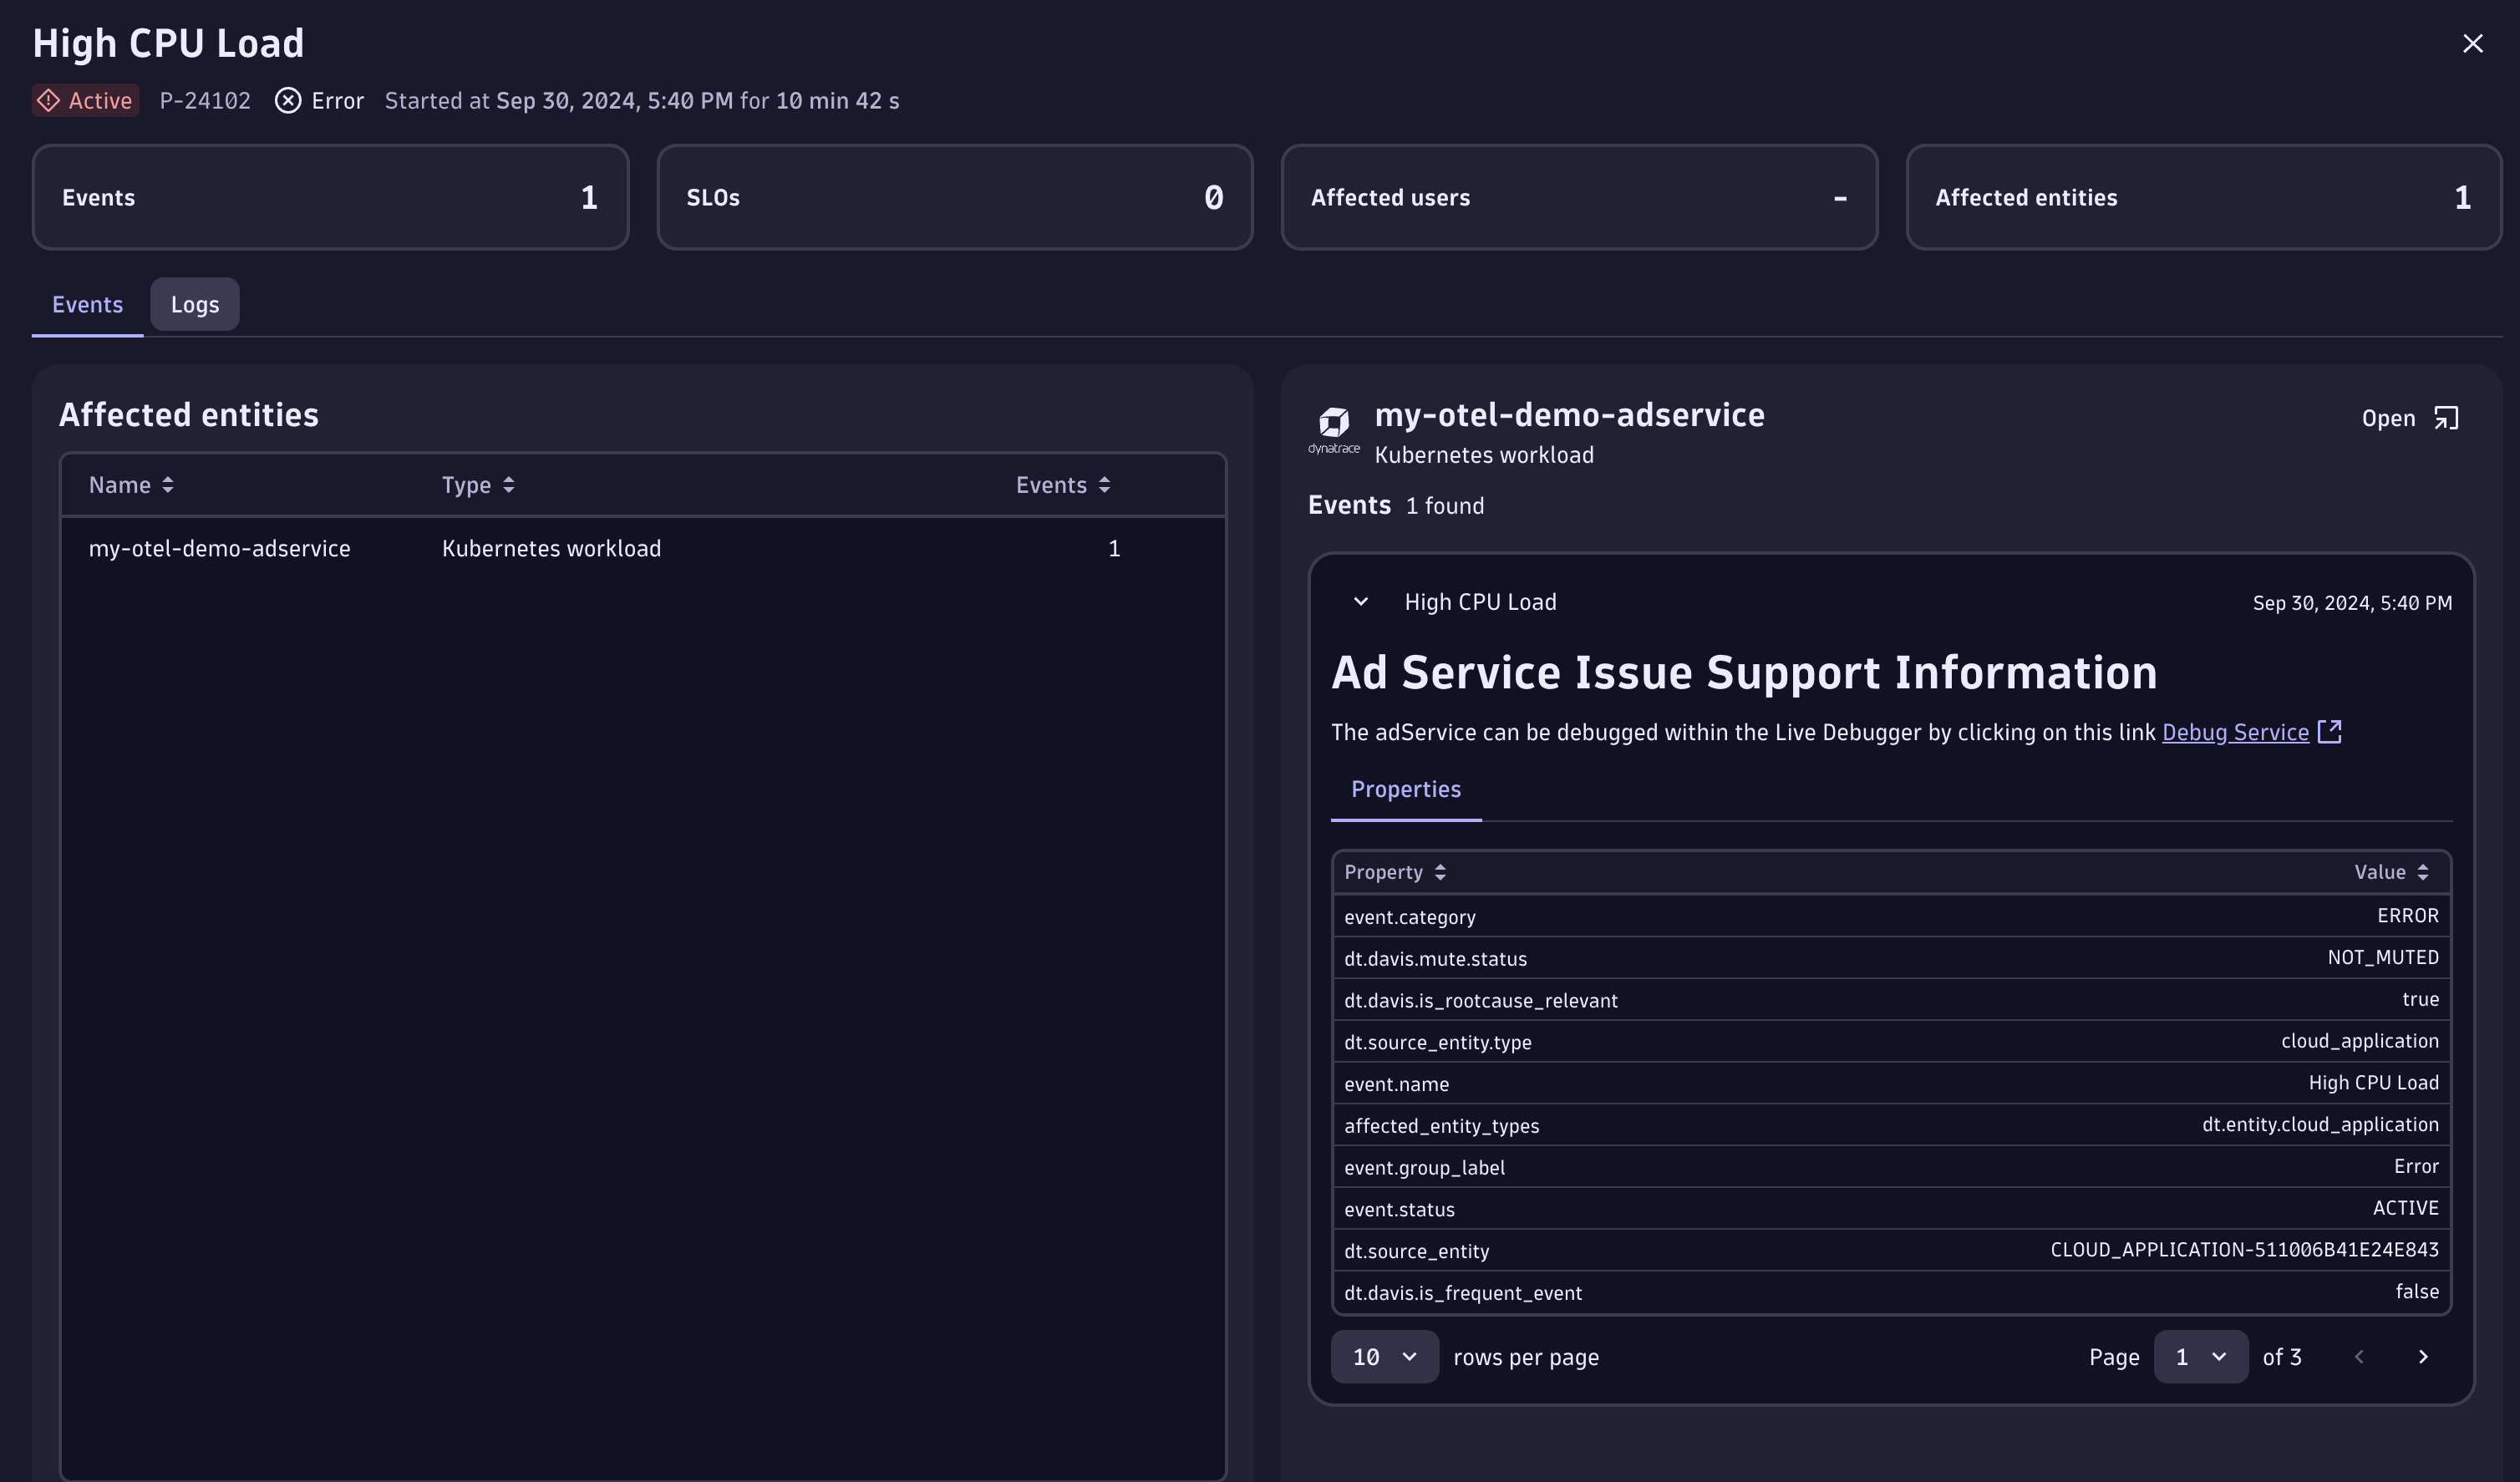
This link allows us to open Live Debugger and dive into the code level of the AdService (example service) without requiring code changes or application redeployments.
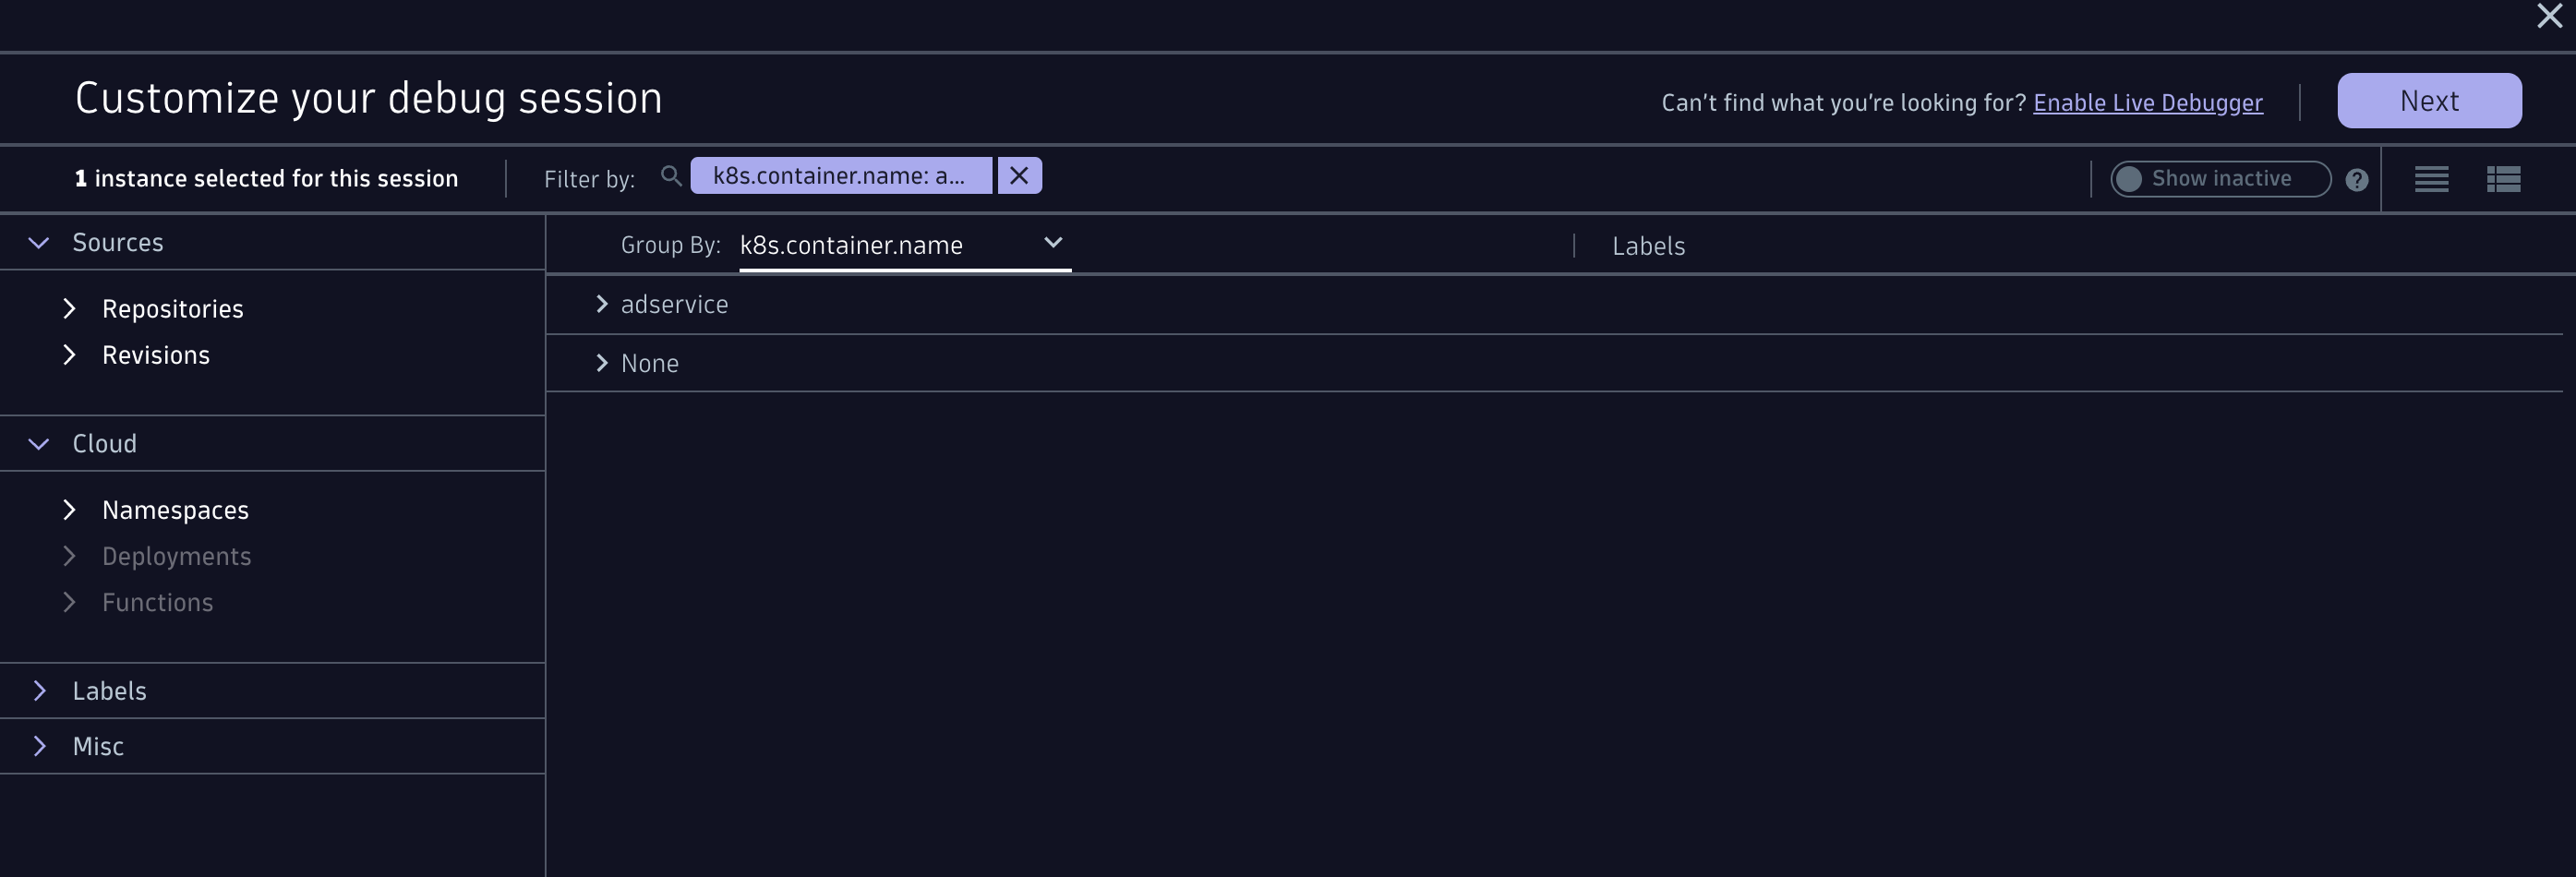
We use the automatically populated filter for AdService and its corresponding source code repository, then select Done to go to Live Debugger.
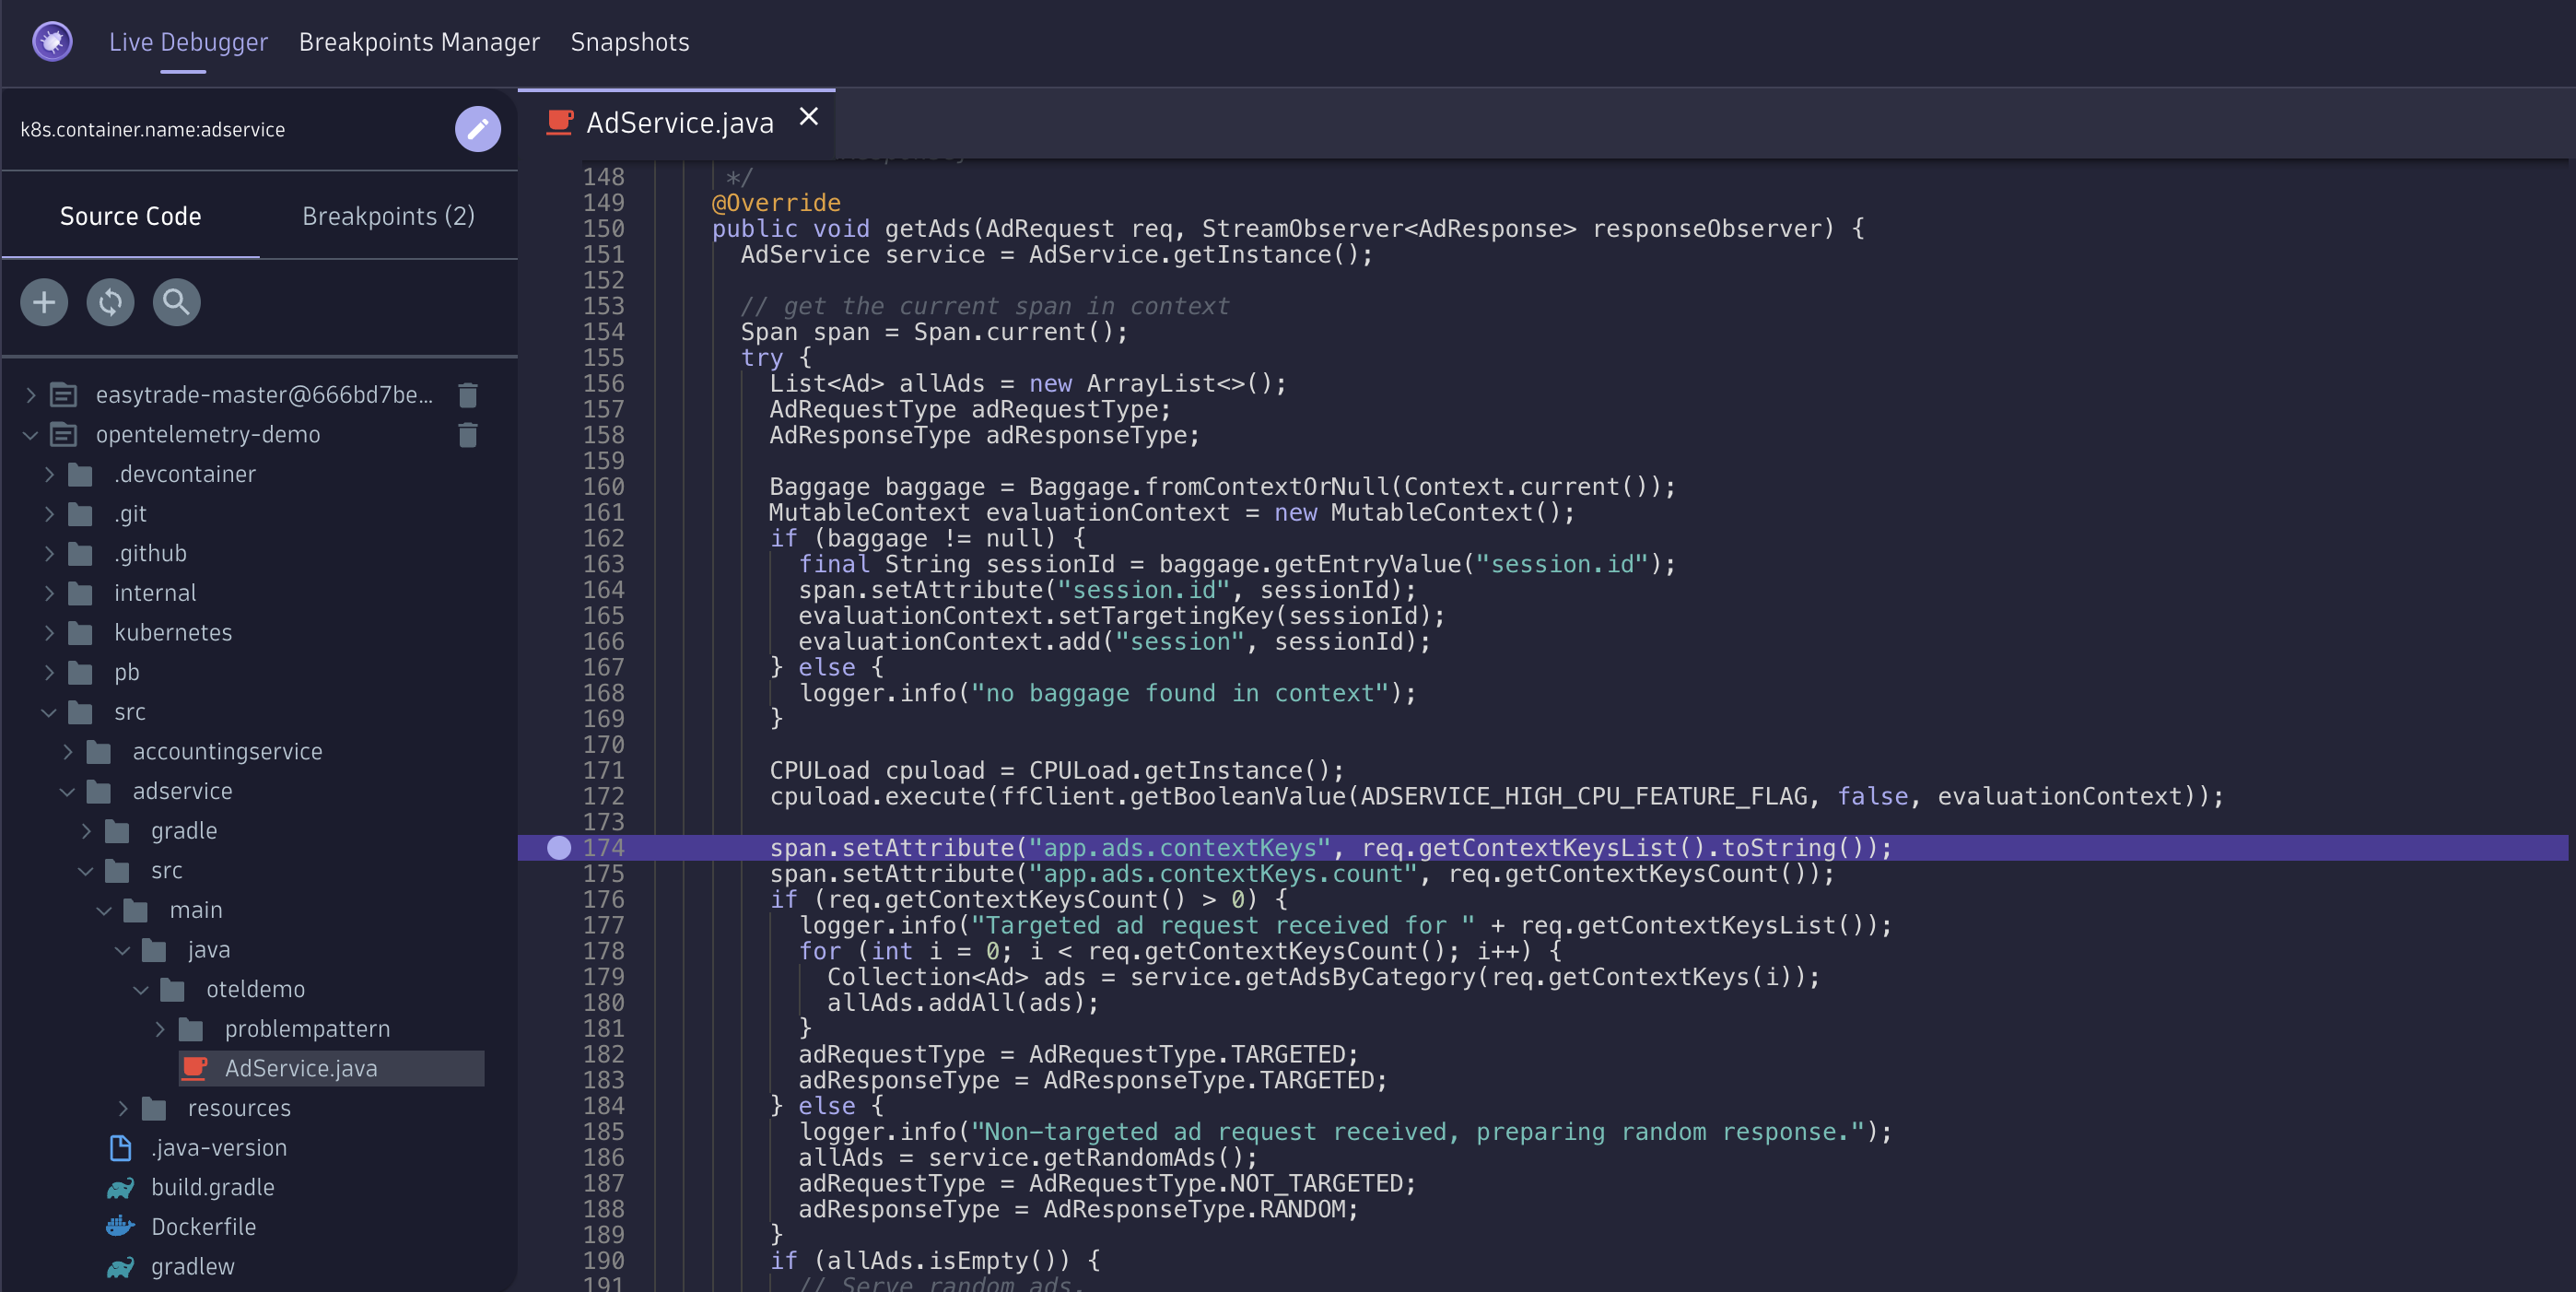
Live Debugger allows you to set non-breaking breakpoints, capturing critical data snapshots in real time. Using this data, developers can inspect local variables, server-process details, thread information, and trace data to identify the root cause of issues. In this case, the debugging process reveals there are background threads potentially consuming excessive CPU resources.

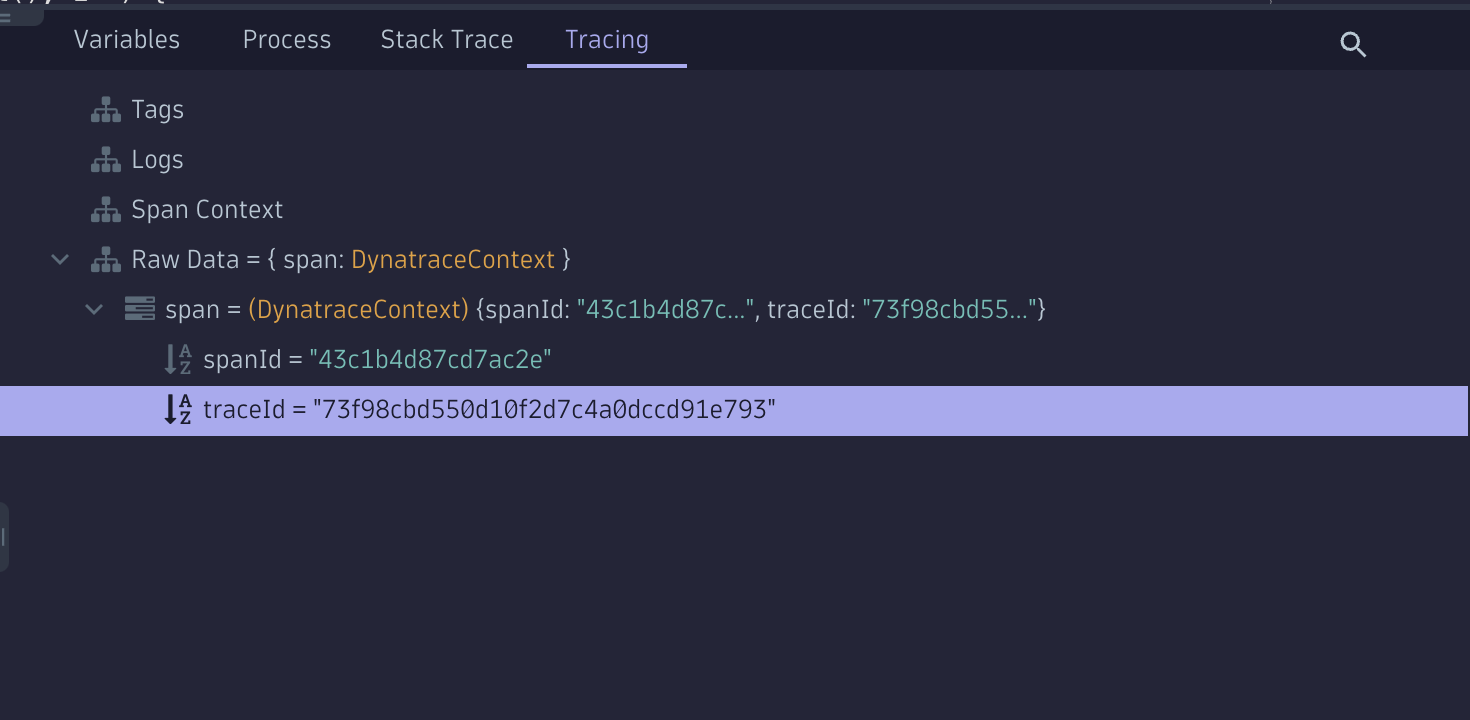
To gather more details about the overall end-to-end transaction and its performance, we can copy the trace ID and navigate to the Distributed Tracing app, search for the trace using the ID, and explore the end-to-end trace.
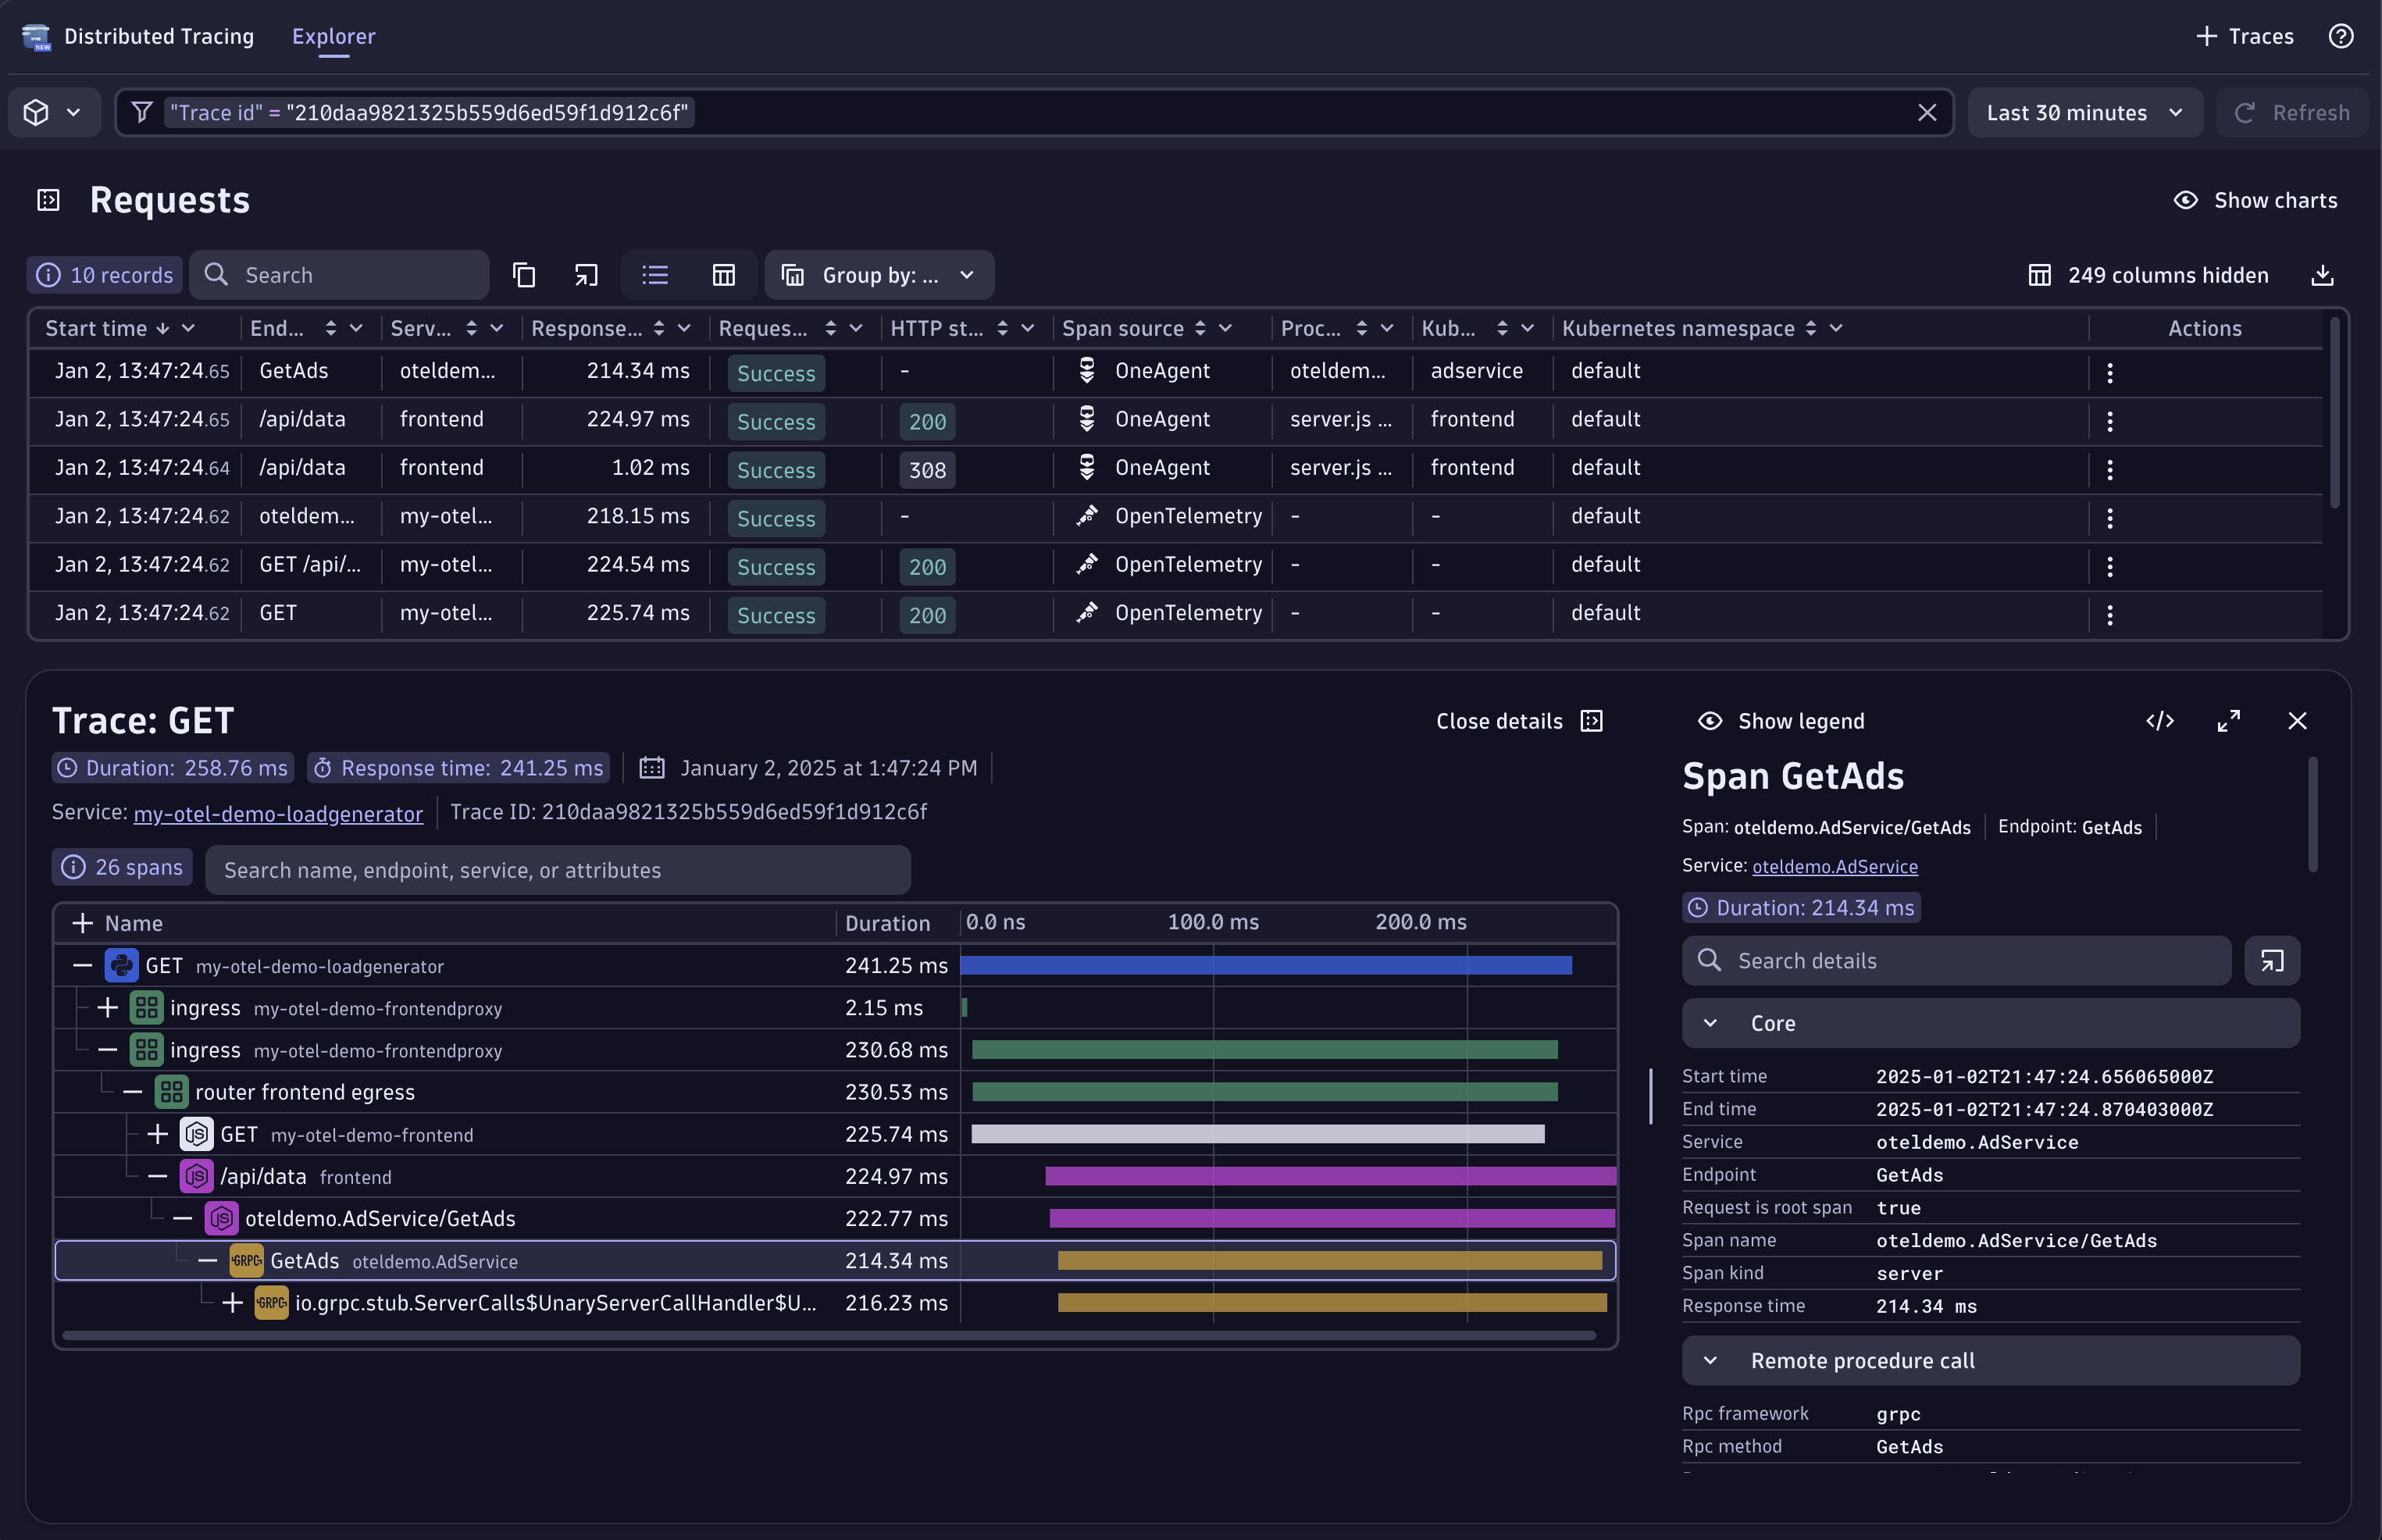
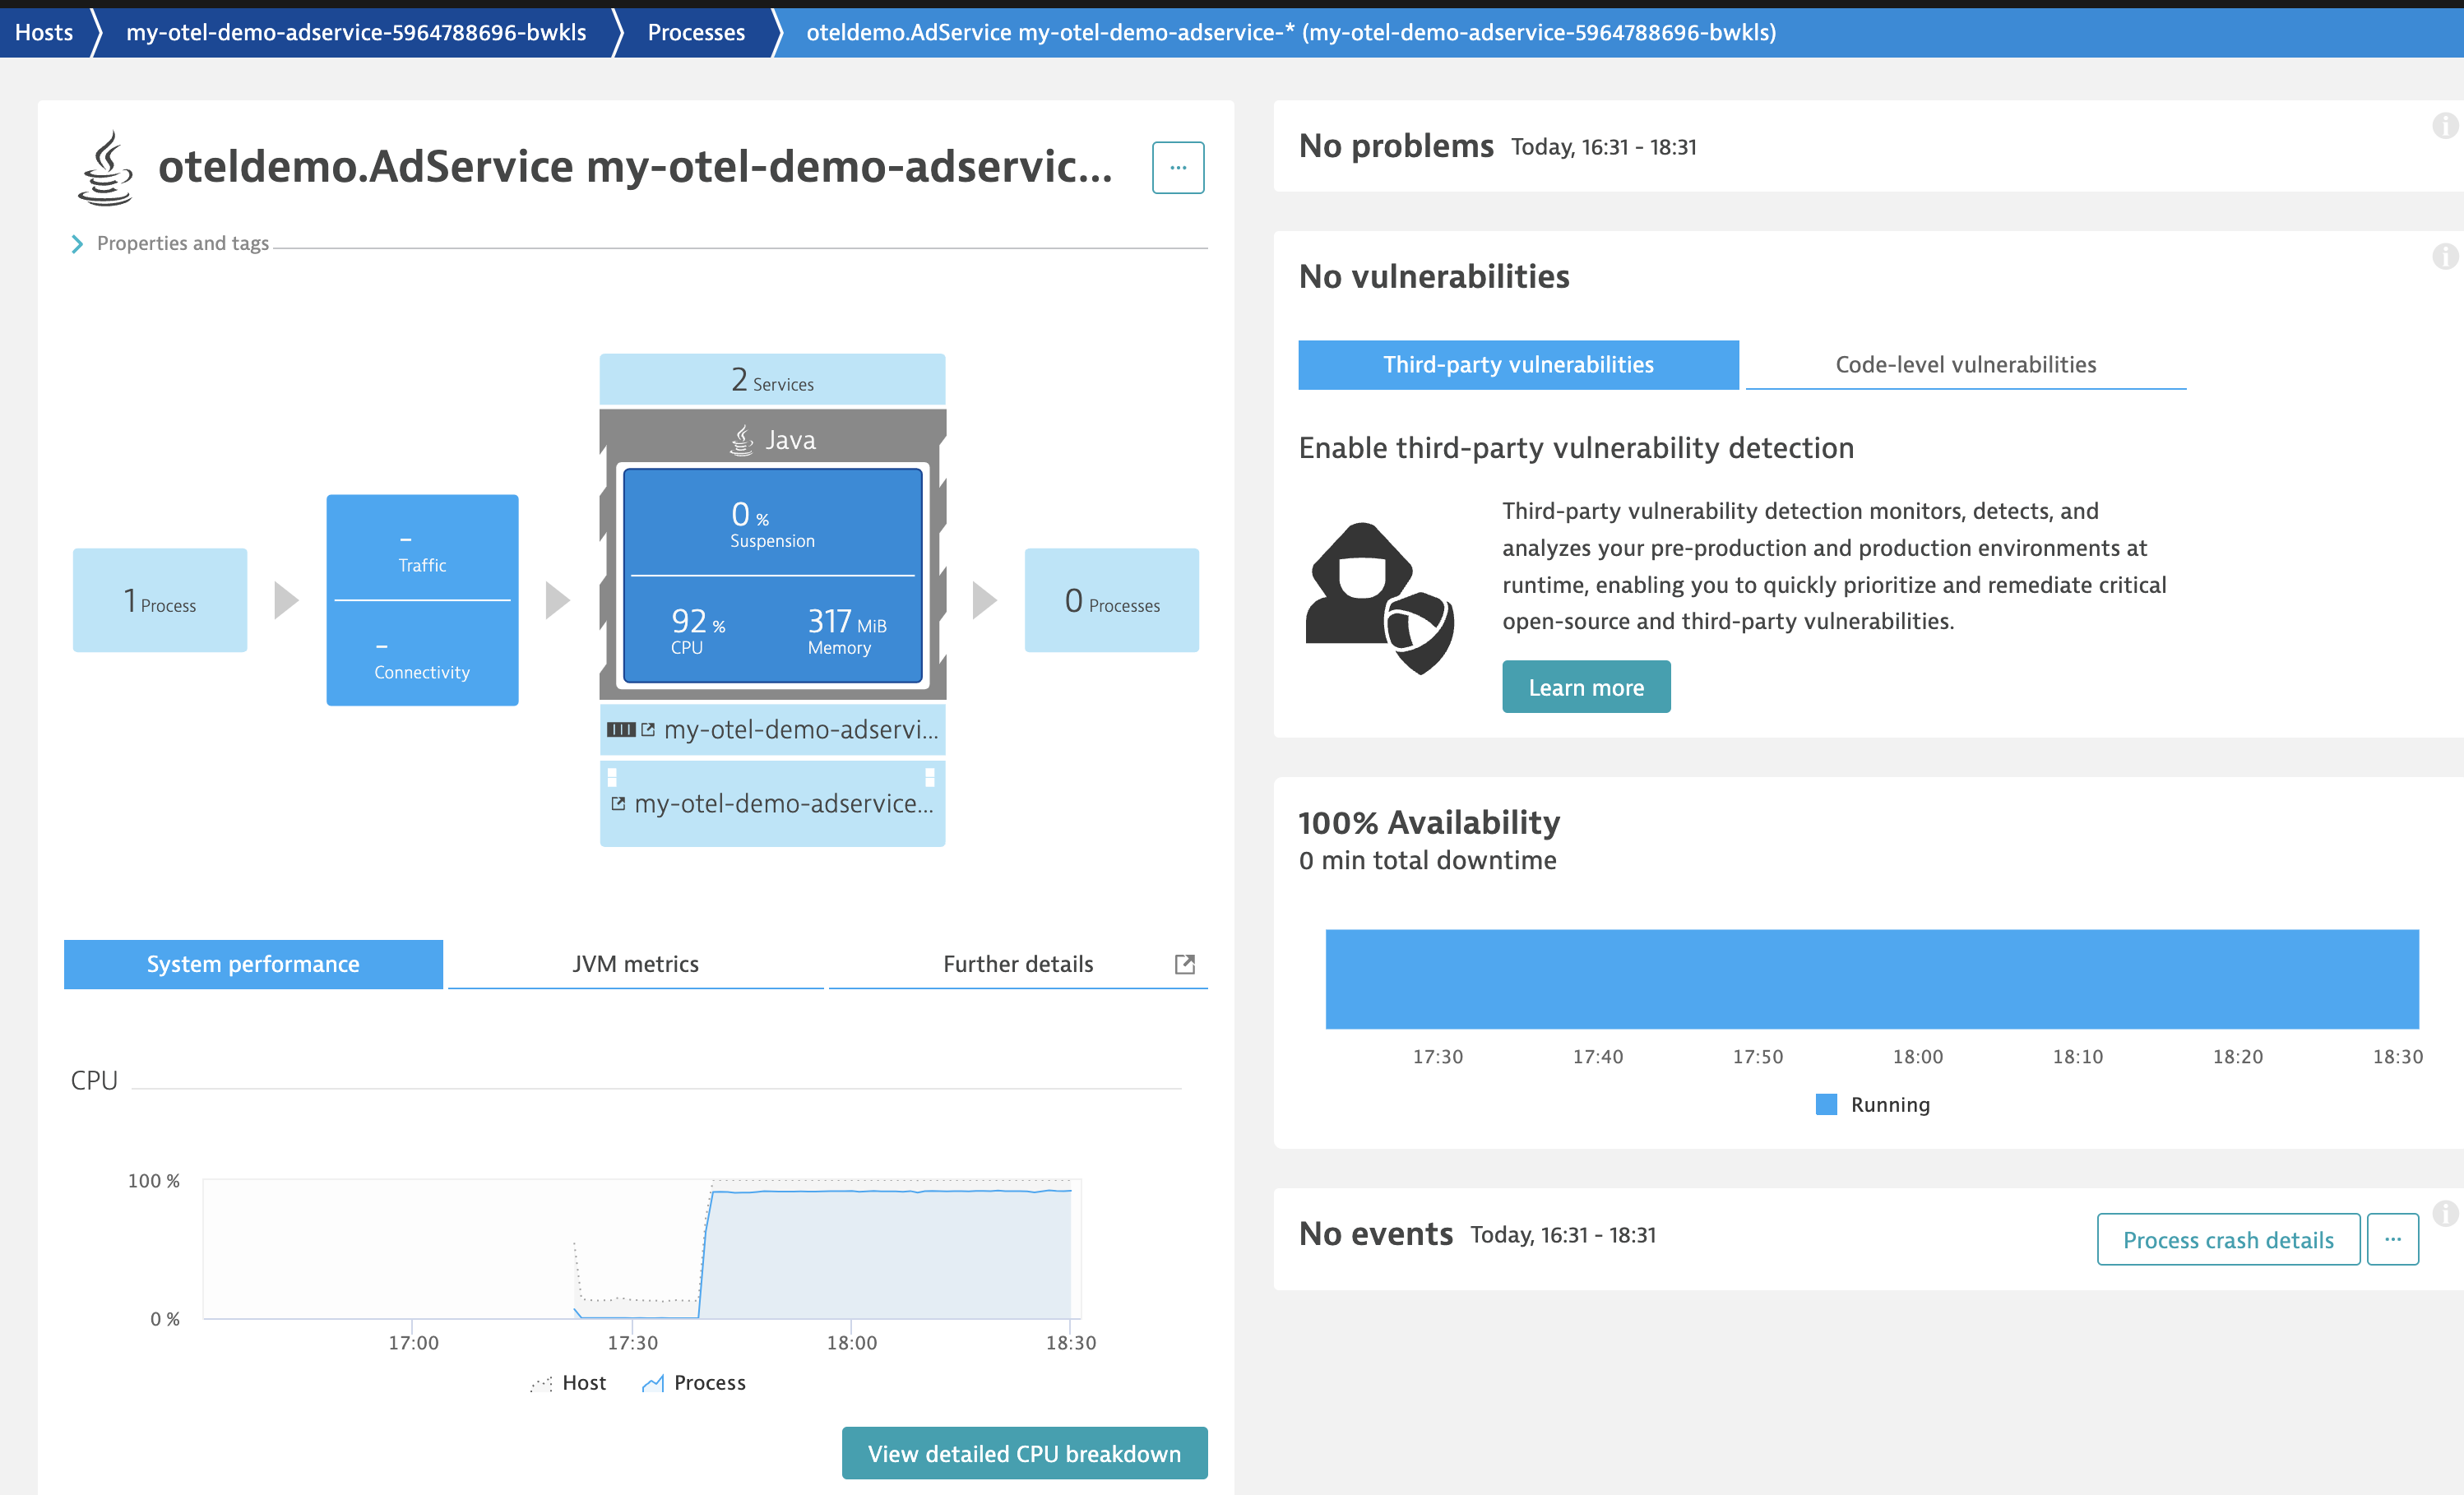
Once we have a clear view of the desired trace, we get more details about the GetAds function where the suspected issue lies. By clicking on the service and navigating to the process details, we can explore this CPU resource utilization problem in more detail.
Dynatrace provides details about the process, which was running fine until the CPS spike; it’s now running at close to 100% capacity.
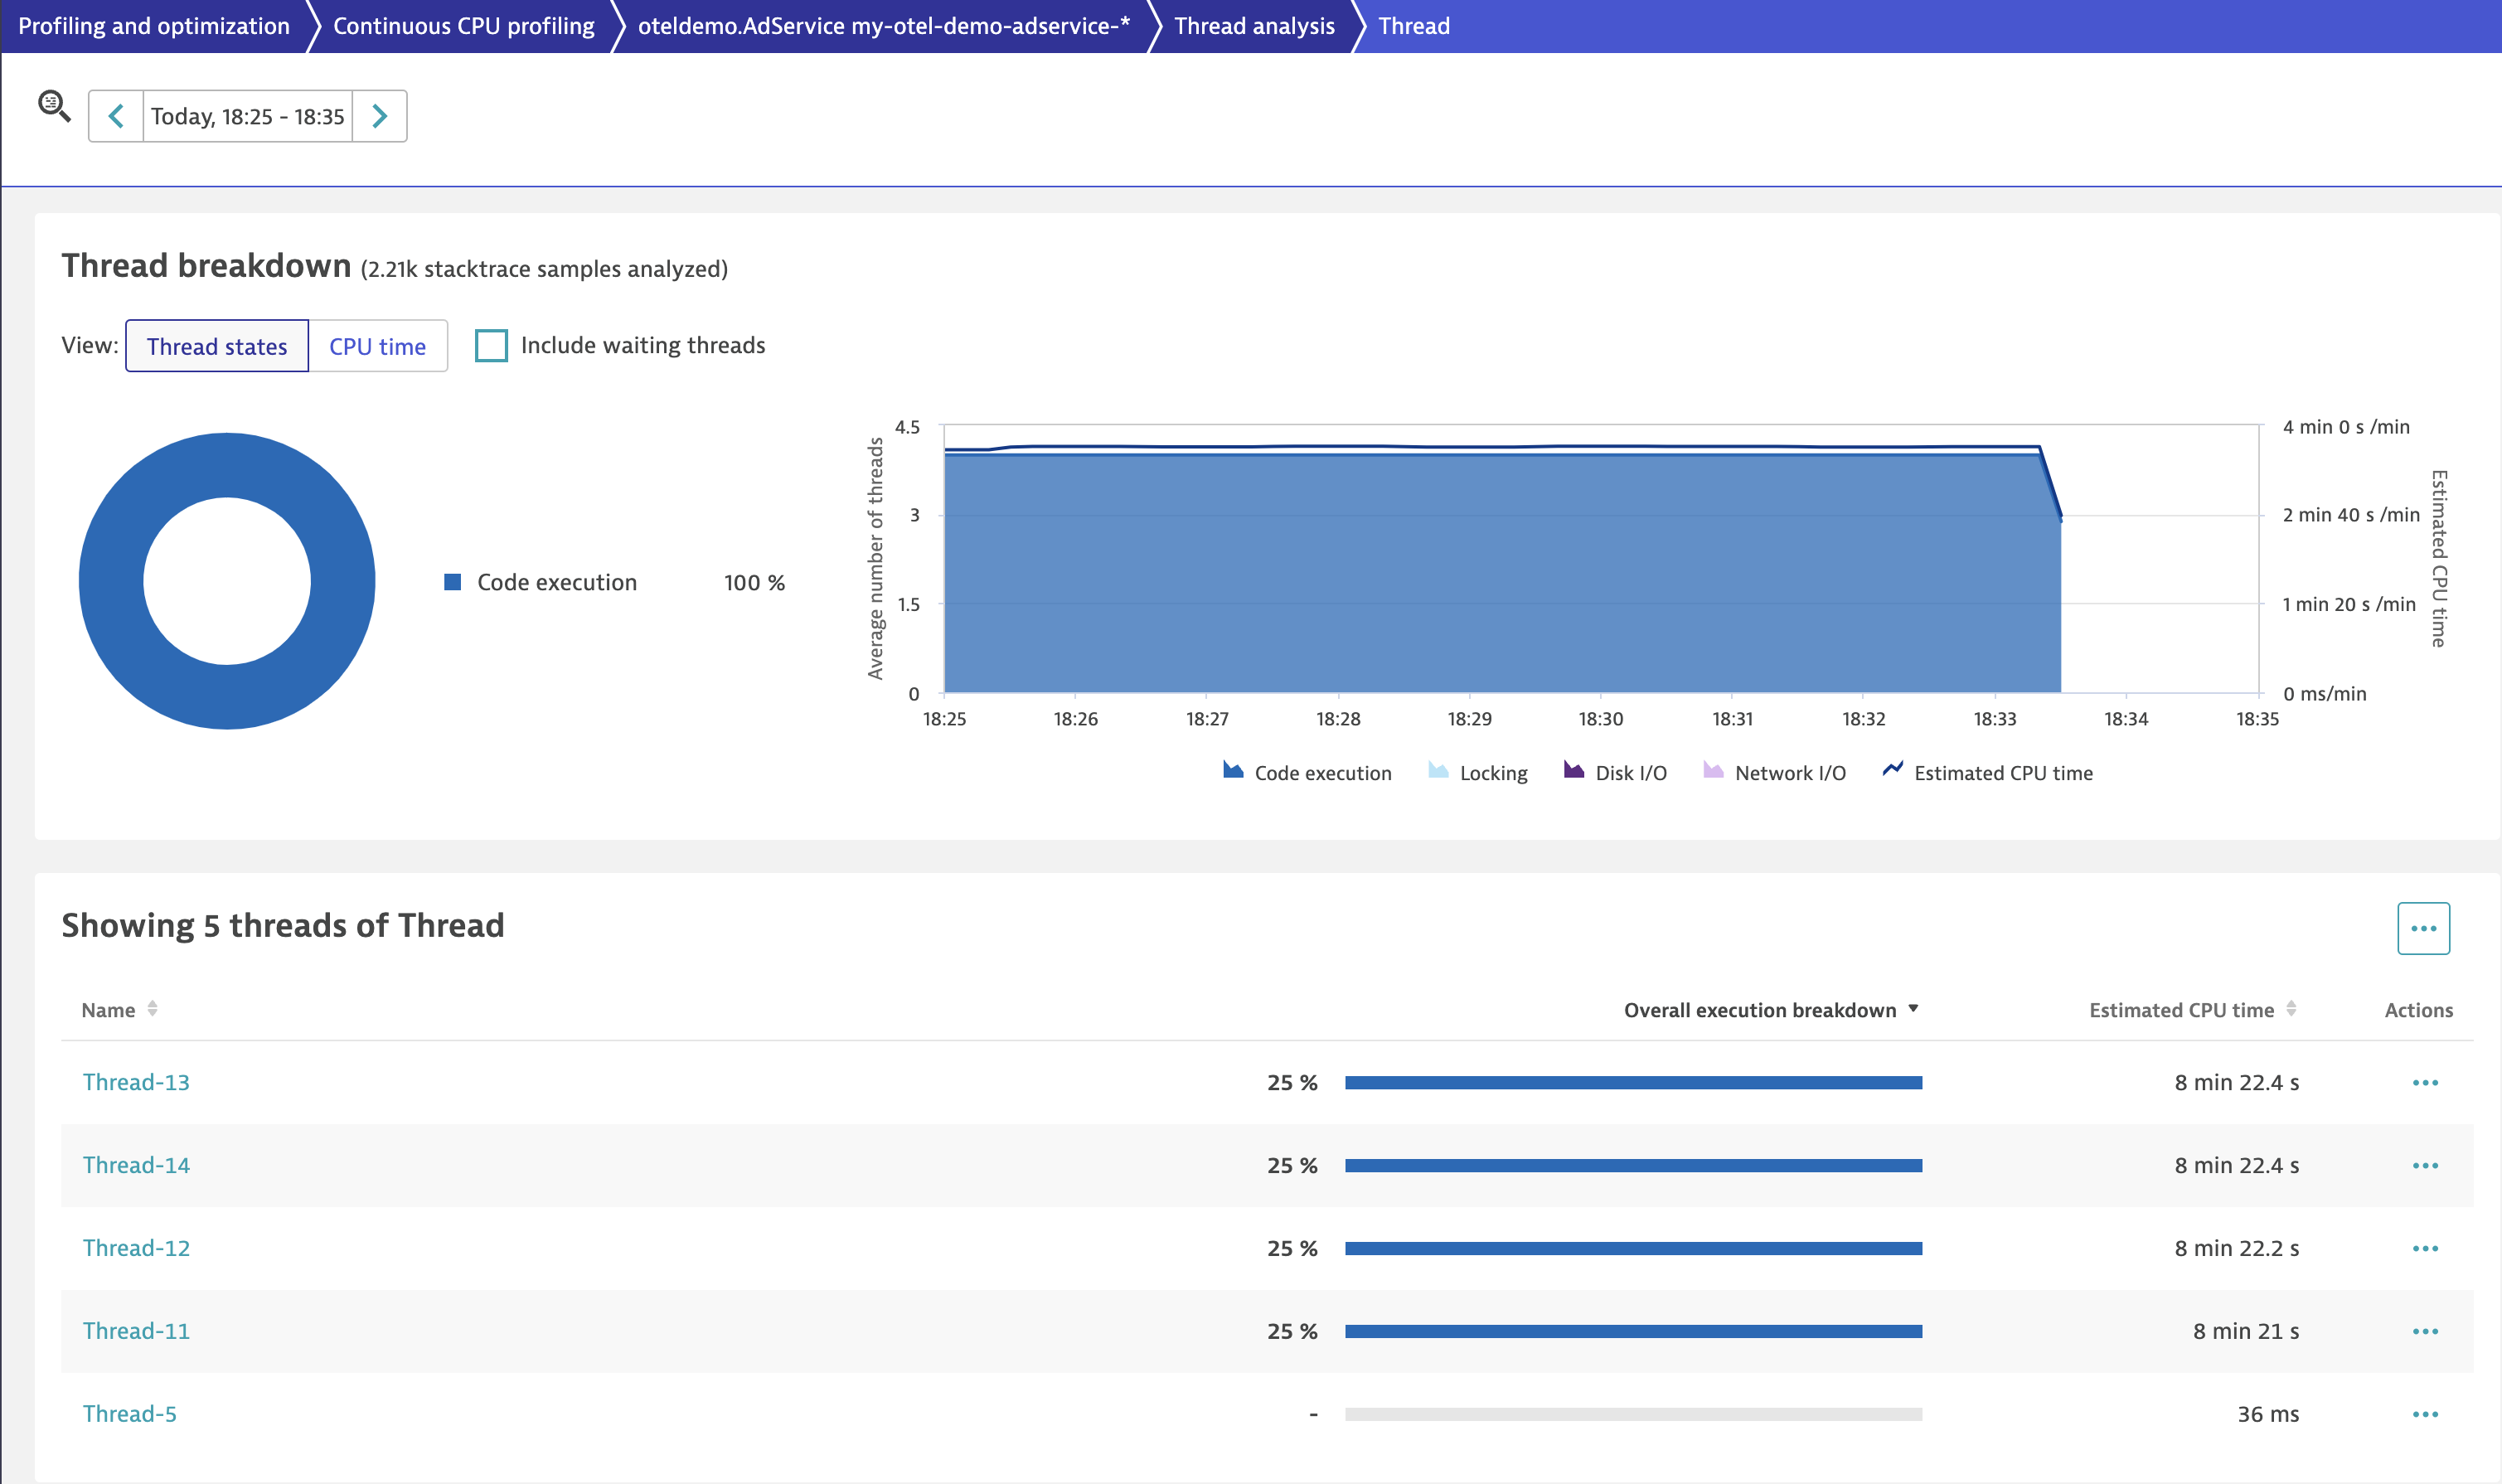
Diving deeper into the detailed CPU thread analysis, we see that background threads contribute to CPU consumption. We can easily analyze those threads.
Now, we can view a breakdown of all the running threads consuming CPU time. Select a “Thread” link to analyze the four threads consuming all the CPU time; these details correspond with the four threads we saw in Live Debugger.
With this information, we can start to see the power and capabilities of Dynatrace in a typical debugging workflow, analyzing data from multiple angles and delving as deeply into the processes or threads as necessary to understand what’s happening.
What’s next
Following this use case, we outlined an example flow for easily and effectively troubleshooting an incident without having to deal with the hassle of production access permissions or time-consuming issue reproduction and redeployments.
Dynatrace Live Debugger will be generally available (GA) within the next 90 days. Upon GA this use case will be made available as a hands-on tutorial.
 1 day ago
3