 1 day ago
3
1 day ago
3
Every software developer has faced the frustration of debugging. Whether it means jumping between multiple windows, sifting through extensive logs to track down bugs, trying to reproduce locally, or requesting additional redeployments from DevOps, debugging poses significant challenges and a resource drain. The problem intensifies when bugs occur mysteriously only in production. A production bug is the worst; besides impacting customer experience, you need special access privileges, making the process far more time-consuming. It also makes the process risky as production servers might be more exposed, leading to the need for real-time production data. This typically requires production server access, which, in most organizations, is difficult to arrange.
This cumbersome process should not be the norm. Developers deserve a seamless way to troubleshoot effectively and gain quick insights into their code to identify issues regardless of when or where they arise.
Racing to the next sprint is the norm everywhere, so rapid iteration and swift problem resolution are crucial. Developers not only write code; they’re also accountable for their applications’ performance and reliability. Unfortunately, traditional methods of debugging—such as local and remote debugging—aren’t relevant in most cases and lack the real-time insights necessary for effective troubleshooting. Also, debuggers were built for local development, not for modern production environments’ massive scale and distribution.
This is why we’re excited to announce the launch of Dynatrace Live Debugger, a revolutionary tool that provides developers with visibility and data access to their running applications.
Introducing Dynatrace Live Debugger
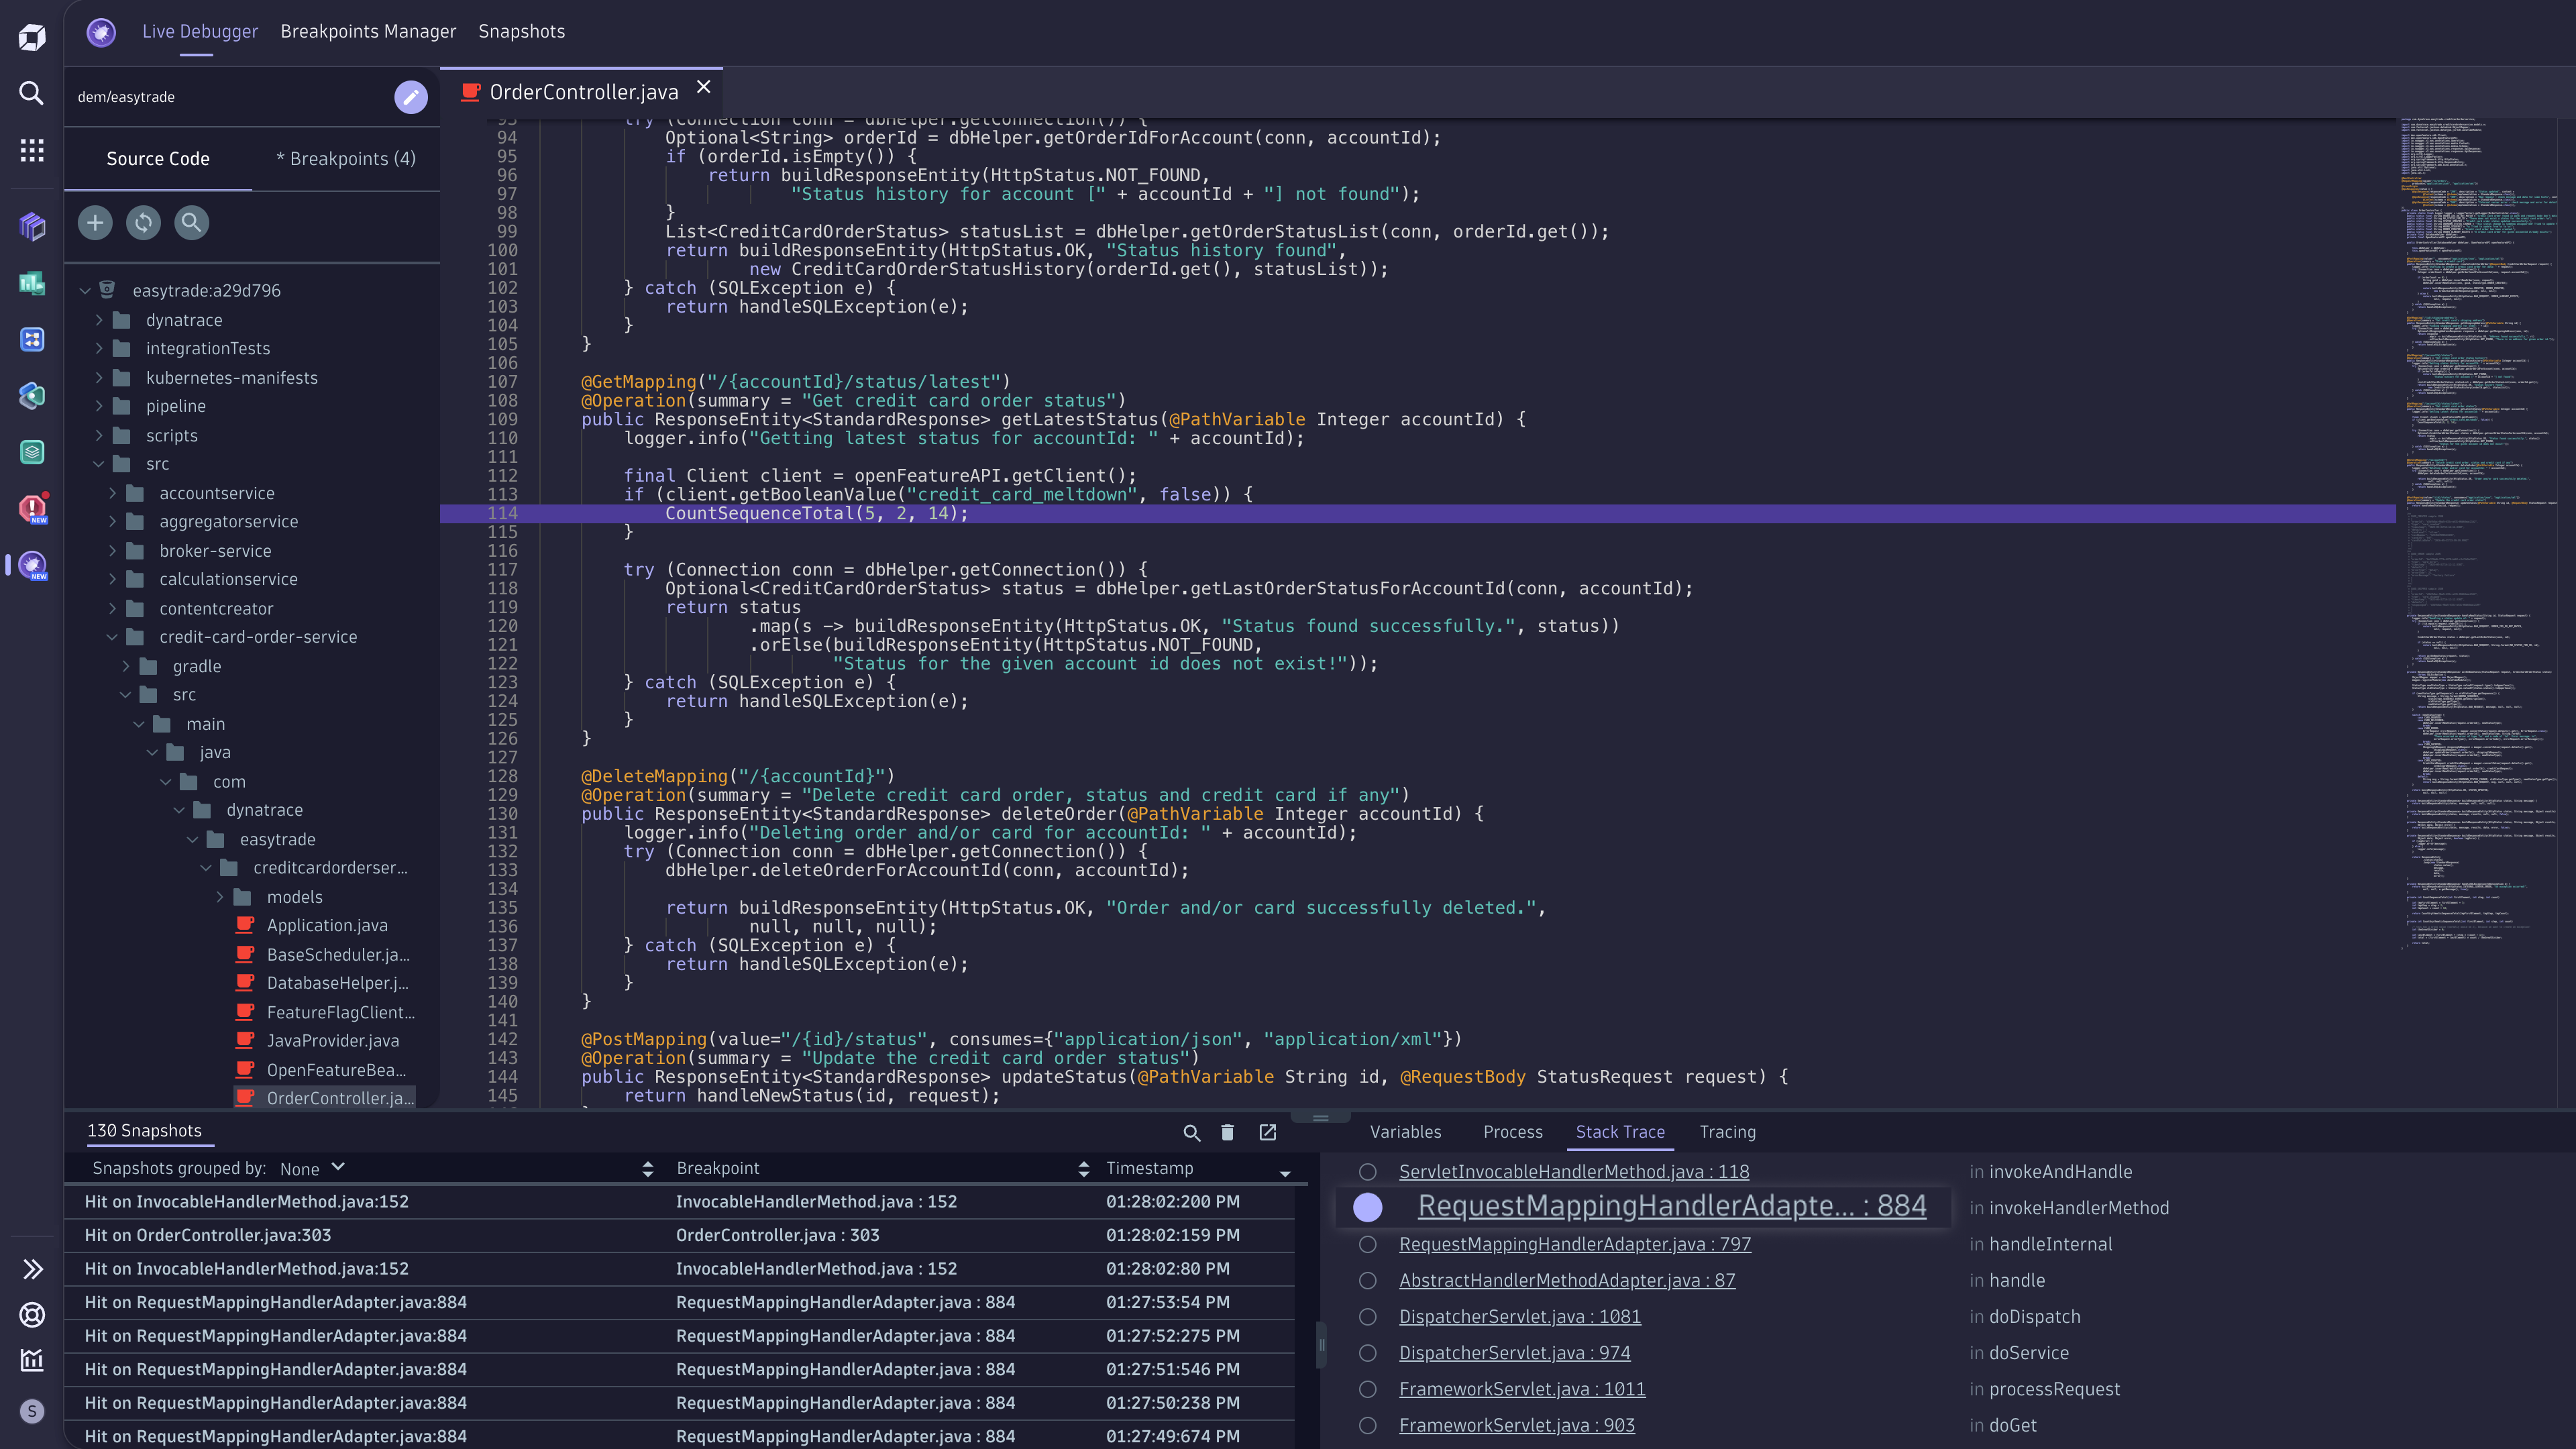
Dynatrace Live Debugger is a cloud-native, real-time deep observability application that gives you instant access to the code-level data you need to troubleshoot and debug quickly in any environment, from dev to production and from bare metal to Kubernetes. With a single click, developers can access the necessary and relevant data without adding new code. No more waiting for CI and redeployment and wasting days trying to reproduce issues locally. Using non-breaking breakpoints allows you to instantly see the complete state of your application, including stack trace, variable values, and more—all without stopping or breaking running code.
Dynatrace Live Debugger makes troubleshooting efficient, seamless, and non-disruptive. Developers are empowered to maintain high-quality applications, resolve issues faster, and suffer less toil.
How it works
Using Dynatrace OneAgent, Live Debugger instructs your application to immediately collect arbitrary application data—a debug-data snapshot—by adding a non-breaking breakpoint, all without stopping your application.

It’s easy as 1-2-3
1. Browse your code.
2. Set a non-breaking breakpoint.
3. Get the debug data you need.
Placing a breakpoint in the code gives you a real-time snapshot whenever the line of code is triggered. This line of code contains elements like variables, stack trace, process information, and tracing. You can limit your breakpoint per timeout value or trigger and set breakpoints per logical parameters.
Debug data from third-party and open source, too!
Debugging third-party and open source code, and even external libraries for which you don’t have the source code, can be an extremely complex task. However, with Dynatrace Live Debugger, it’s easy and seamless.
At Dynatrace, we understand your challenges when dealing with external packages—whether you’re hustling with reverse engineering, automatically fetching open source code, or playing the guessing game.
Dynatrace Live Debugger can work for closed third-party libraries, like Apache Tomcat, SpringBoot, ExpressJS, and more, even when the source code is unavailable. Dynatrace just needs the file name and the line number to collect the debug data.
The problem: Where do you place the non-breaking breakpoint when you don’t have the source code?
The solution is to focus on the stack trace to pinpoint where third-party code interacts with your code. Setting breakpoints in the stack trace allows you to observe the execution flow without needing the source code. This method allows you to collect valuable data, such as local variables and arguments, without impacting application performance or wasting precious time.
Work the way you want
There are those jokes about developers never leaving their IDEs. Well, every good joke has a pinch of truth to it.
Many observability tools cause developers to disrupt their workflow. Dynatrace
provides a powerful and flexible way to work. Get live snapshots of remote environments and debug or validate fixes directly in your favorite IDE or in the Live Debugger web app, wherever works best.
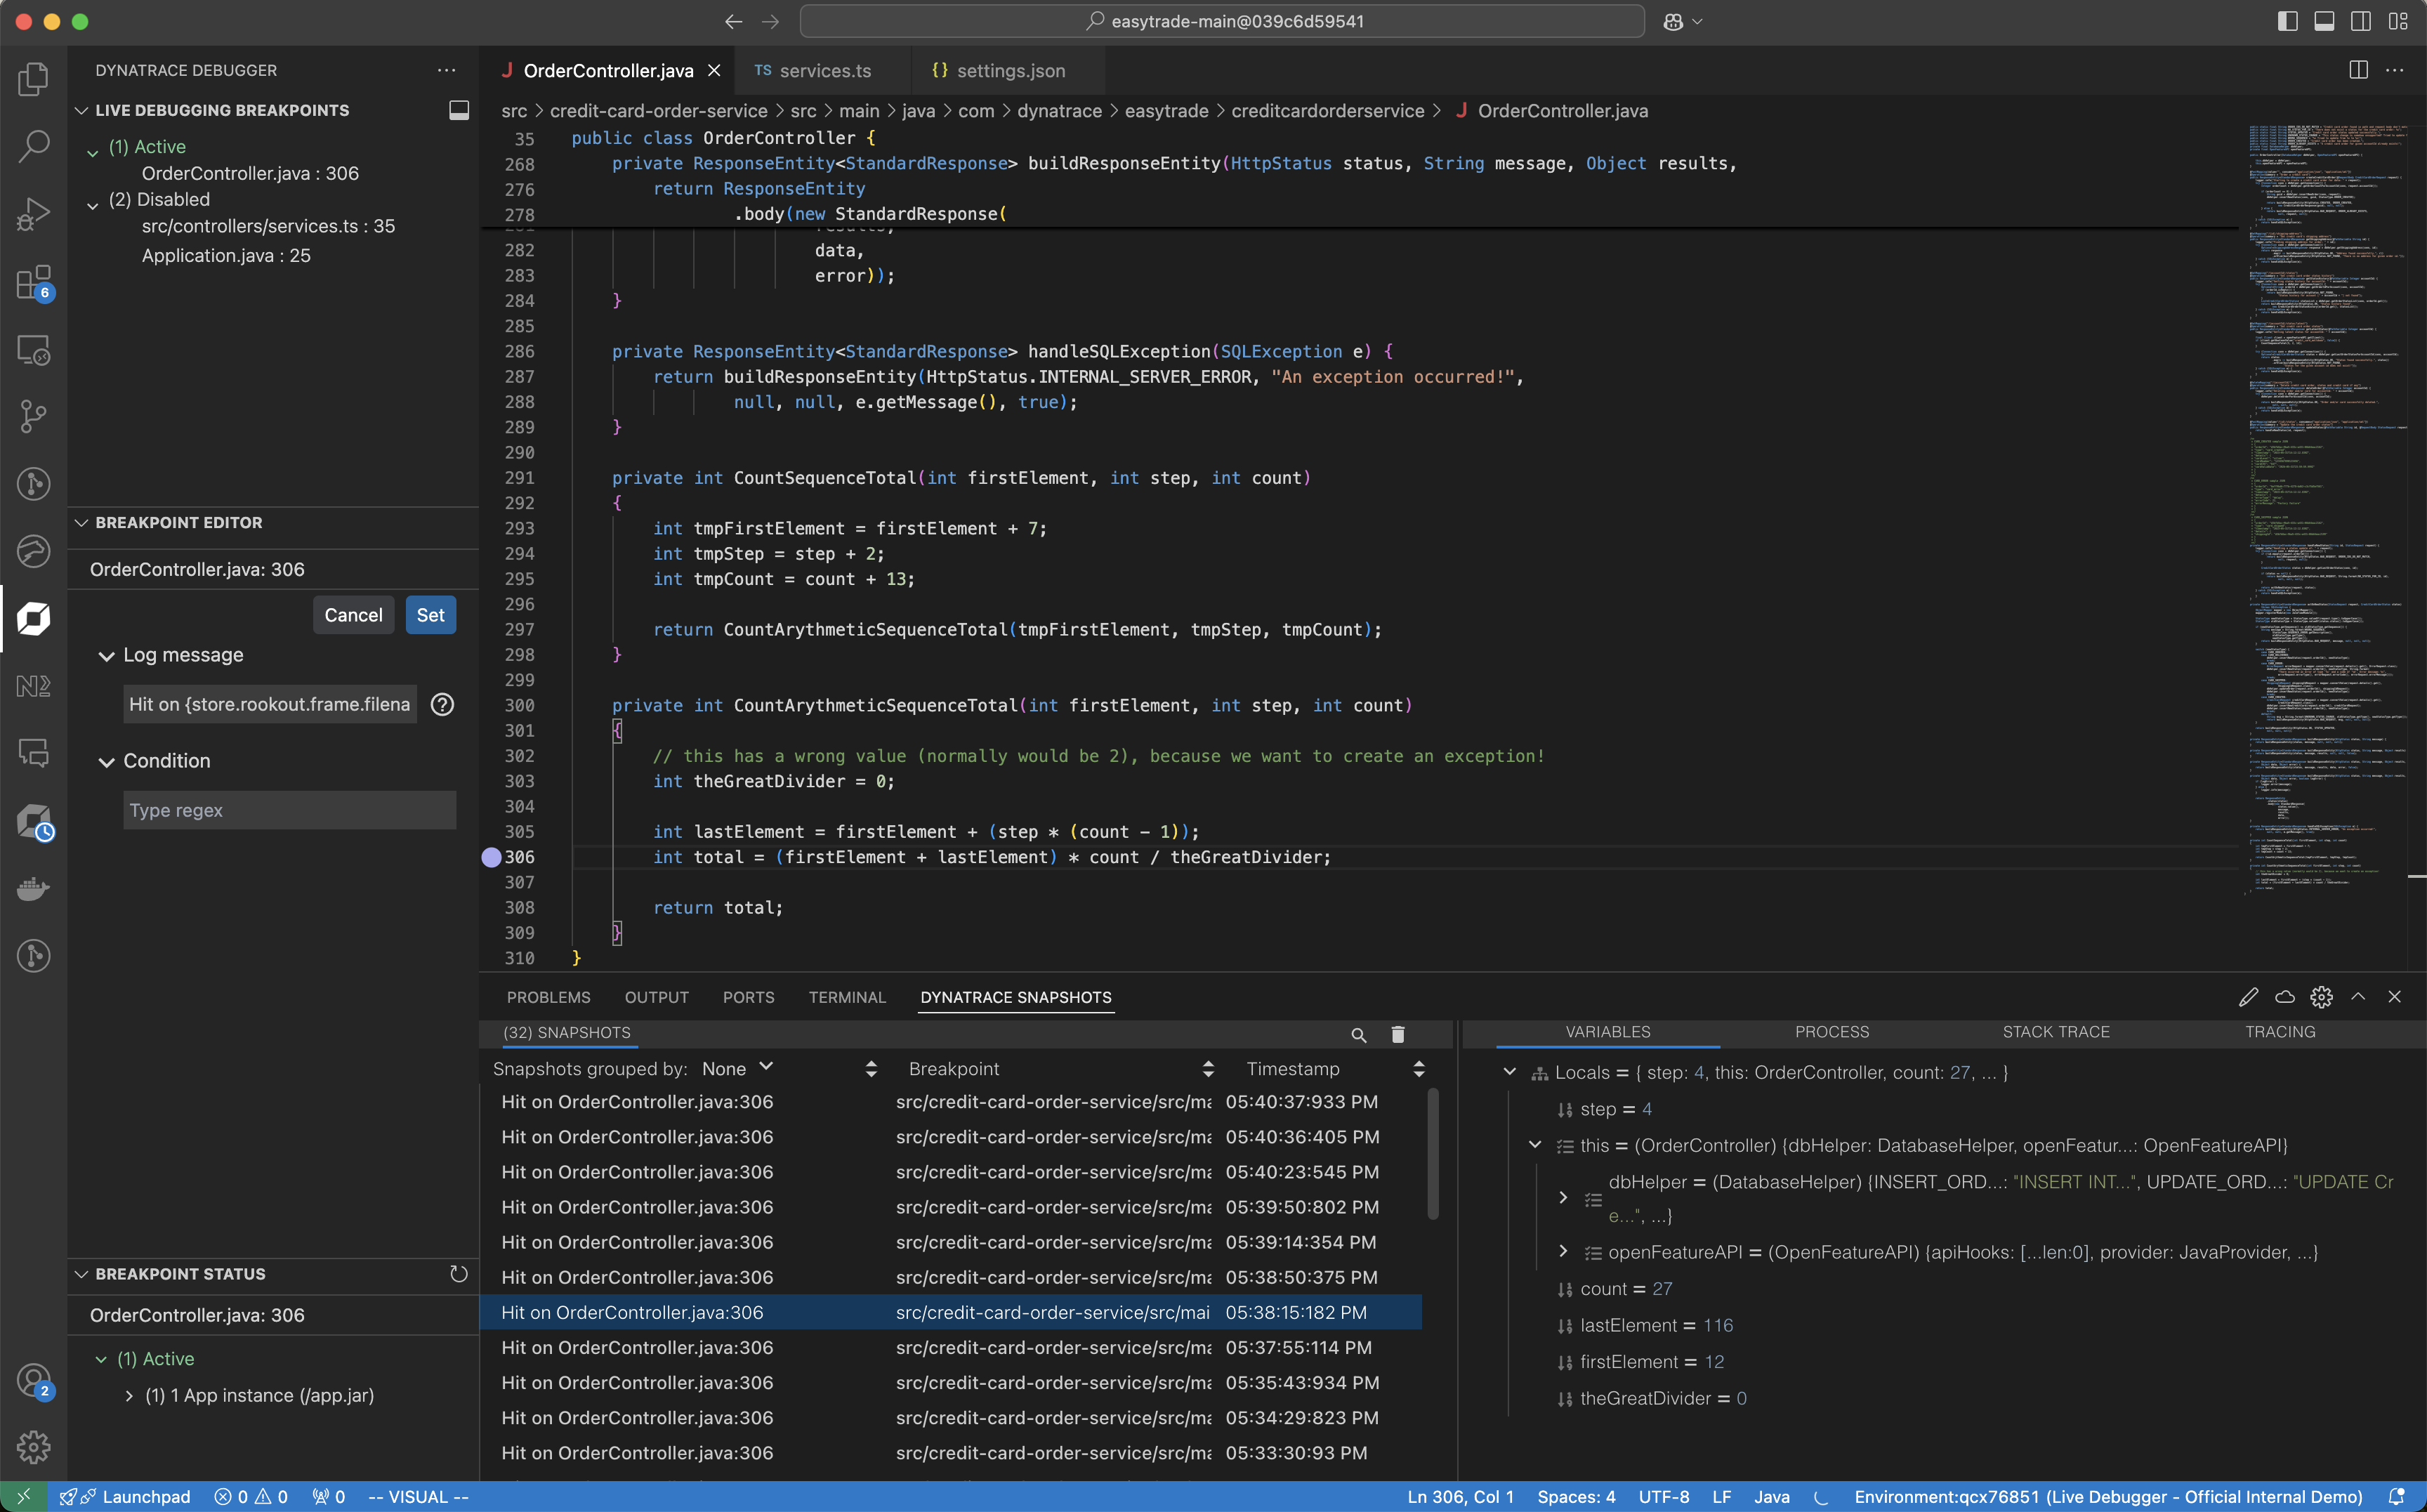 Live snapshot Visual Studio Code IDE
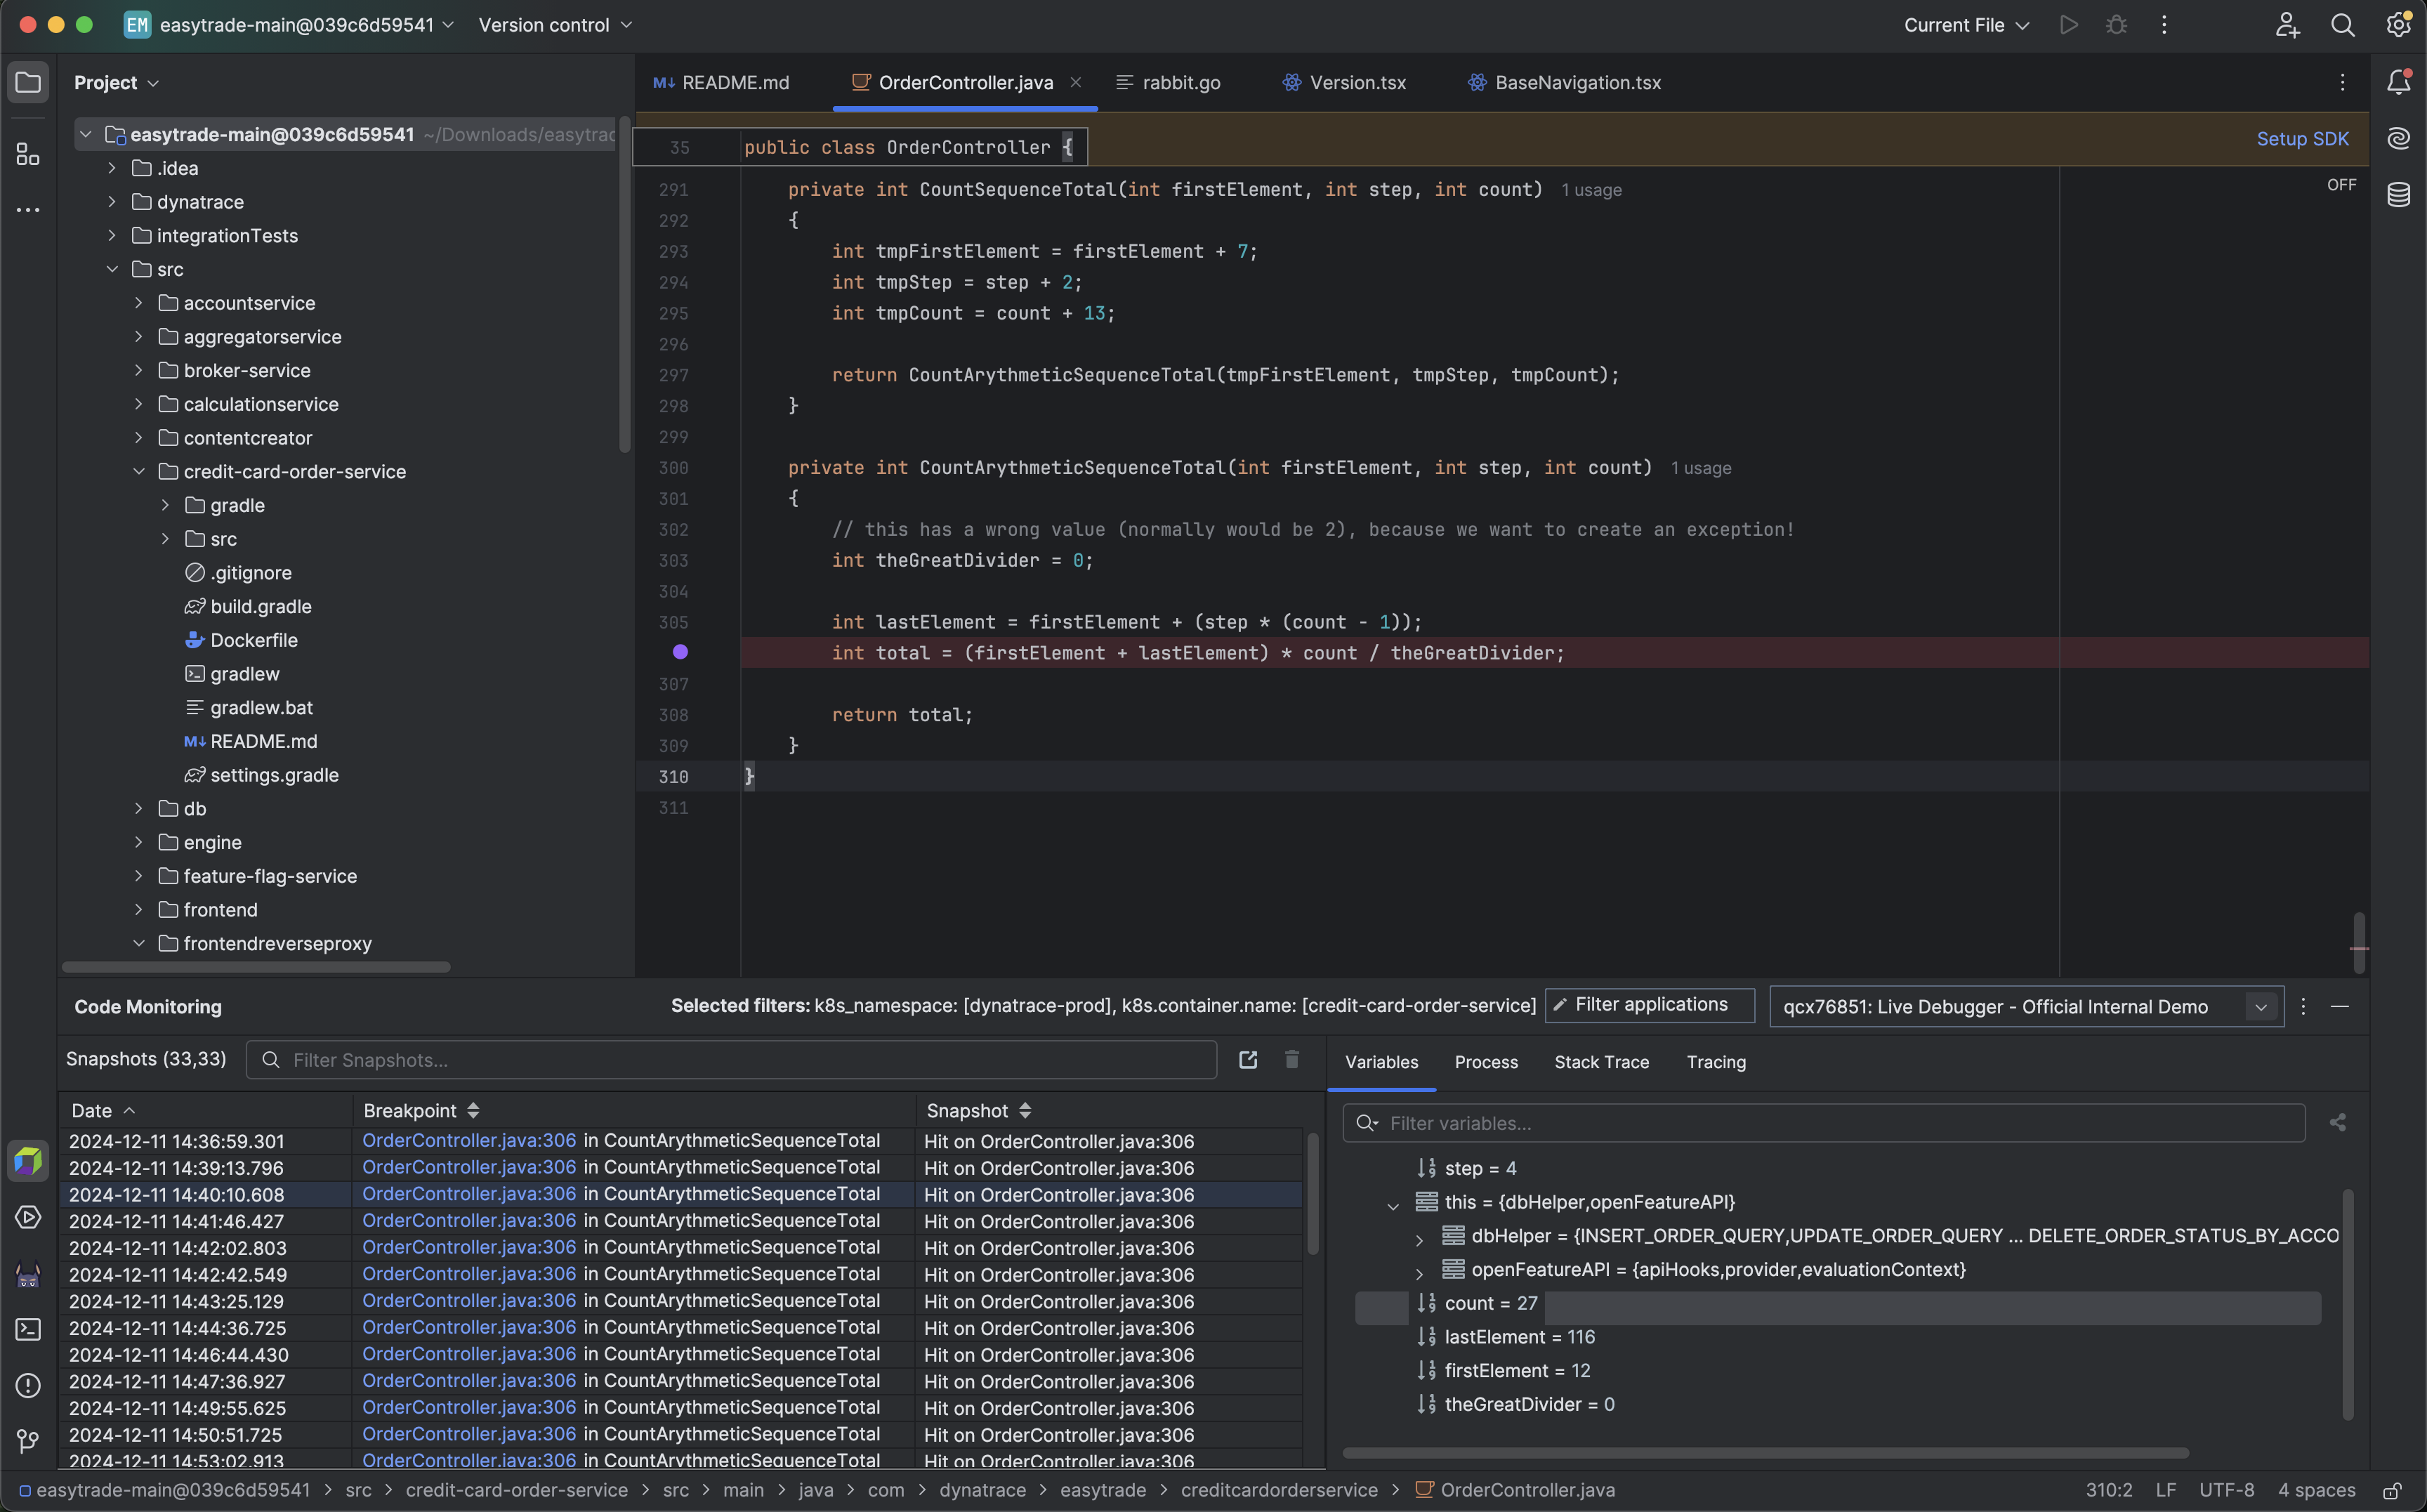 Live snapshot IntelliJ IDE
Get even more context and telemetries from Dynatrace into your IDE
Having real-time code-level data available within the IDE is only the beginning.
Imagine having all your observability-related data at your fingertips.
Soon, developers will be able to instantly access additional relevant telemetry data directly from their IDE with a single click. After getting a live snapshot from the production code, you can see all related logs, which will be delivered from the Dynatrace platform directly to your IDE or Live Debugger application.
The unified observability context that brings together the platform telemetries and non-breaking breakpoint snapshots is revolutionary. It saves time and gives developers a deep understanding of their code’s behavior, making the processes significantly more efficient and effective.
Enterprise-grade regulations for your code and operations
Getting real-time insights from your code is crucial to your development efficiency and well-being. However, that would be worthless if your code base is insecure or data privacy is breached.
- Data privacy: At Dynatrace, we take a proactive approach to data privacy. Dynatrace protects your data end-to-end; the Dynatrace platform is built and operated with strong privacy controls. Privacy configurations, such as data masking, data access control, debug data retention, or privacy rights, are available to enable you to maximize the platform’s value and meet your privacy requirements.
- Source code isolation: Live Debugger integrates with source control management systems to display the correct source code revision and provide a seamless debugging experience. Designed from the ground up, this process aims to protect source code security and follow vendor best practices provided by relevant vendors. Source code is loaded only on an engineer’s workstation, using the engineer’s privileges. Dynatrace servers never access, process, or store customer source code.
- Security and compliance: Dynatrace is highly committed to information security management. Security and privacy controls implemented in Dynatrace are designed to meet the requirements of major regulatory frameworks globally. Find the list of supported frameworks in our Trust Center.
For more information, you can look at the Live Debugger Security and Privacy whitepaper
Summary and availability
Live Debugger lets you debug your production environment, or any remote environment, like never before, right from the IDE with the level of observability insight, scale, and security that enterprises demand.
Dynatrace Live Debugger is currently in preview and will be generally available within the next 90 days.
More information on the Dynatrace Observability for Developers offering can be found in the Observability for Developers blog post and the Observability for Developers webpage.