Do you struggle to find the right data amidst all the data in your observability tools? This can make it hard to focus on what matters for your role.
Today, we are excited to introduce log scopes for Cloud Logging – a major advancement in how you manage and analyze your organization's logs. Log scopes are a named collection of logs of interest within the same or different projects. They are made up of groups of log views that control and grant permissions to a subset of logs in a log bucket.
For example, imagine your organization has two log buckets: log bucket A with log views X, Y, and Z; and log bucket B with log views M and N. You can now create a log scope Q that encompasses log views X and Y from log bucket A and log view M from log bucket B.
Together with metrics scopes, log scopes let you define a set of correlated telemetry for your application which in turn can then be used for faster troubleshooting or referencing for insights.
Log scopes example use cases
Below are some example use cases for you to get a sense of the log scope’s value proposition.
Use case 1: Correlating metrics with logs from the same application when an organization uses a centralized log storage architecture
In a centralized log storage architecture, your organization could have routed all logs from applications to a centralized project (e.g. Project Central in Figure 1 below) using a bucket sink, in order to easily manage configurations, access control, and cost.
Given this setup, you may want to create a dedicated observability view for your application in your project. Metrics scopes together with log scopes let you do just that, as shown in Figure 1 below.
For this you would create a log scope in your project (Project App1) that links to the log view of App1 in Project Central.


Figure 1 - Diagram of how a user working in an organization with centralized logs can create an application-specific view of correlated telemetry in their project with log scopes and metrics scopes.
Use case 2: Correlating metrics with logs for isolated environments such as development, staging and production across projects
Your organization may want to monitor applications by isolated environments like production, staging and development. Logs for each isolated environment can now be easily grouped as a log scope as shown below.
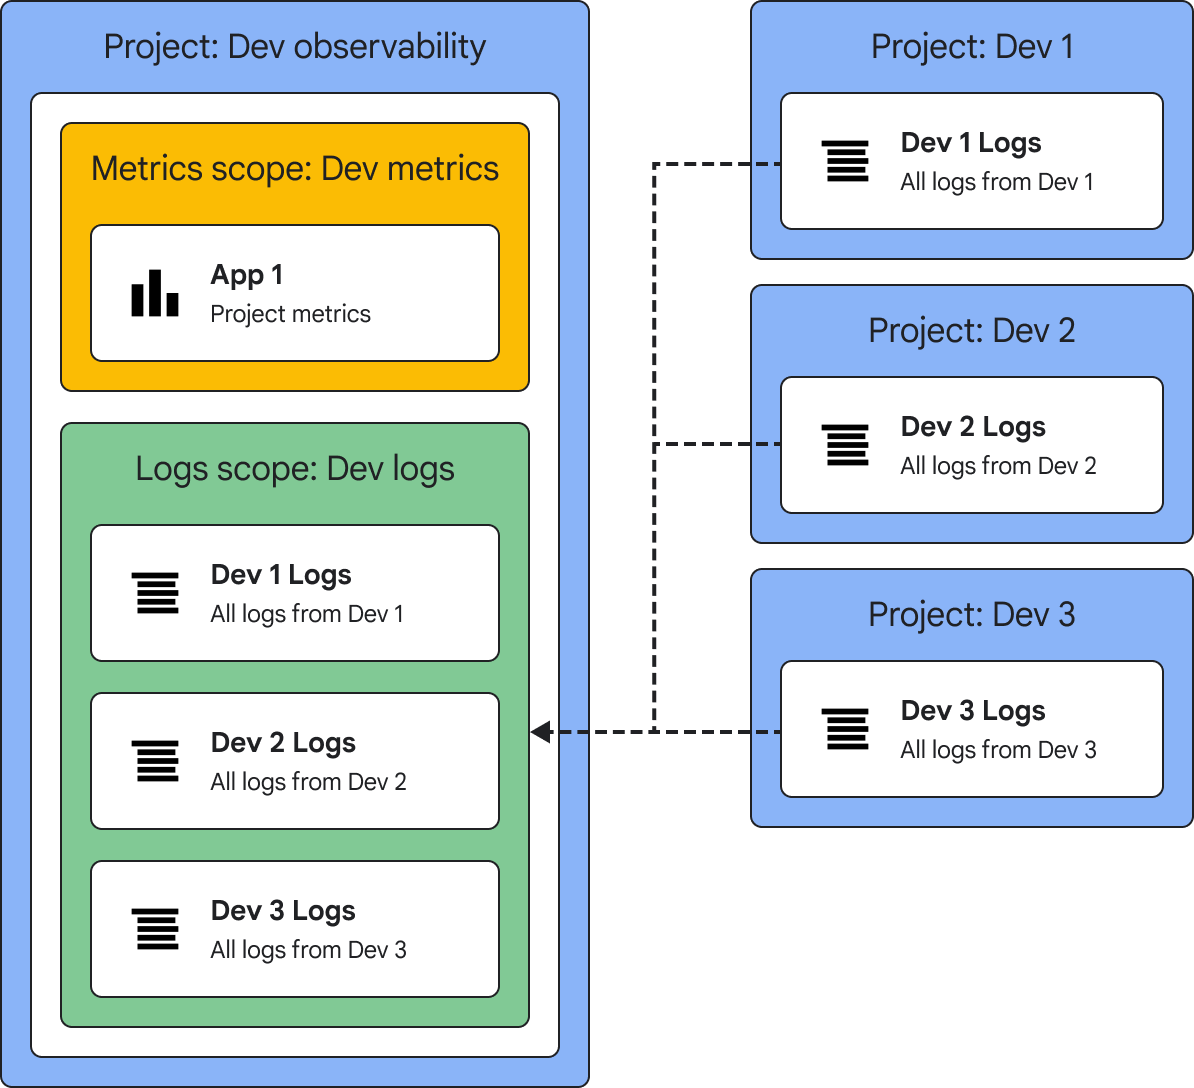

Figure 2 - Diagram of how isolated environment logs can be pulled into a specific observability project.
Get started with log scopes today
Log scopes are available now in the Google Cloud console. You can create multiple Log Scopes as required by the needs of your organization, and a default log scope has been created for every project in the console.
To create a log scope, navigate to any Cloud Observability page such as Logging, Monitoring, Trace or Error Reporting and select the Settings option in the left-hand navigation bar. Follow the on-screen prompts to create and manage a log scope. See demos below and supporting documentation here.
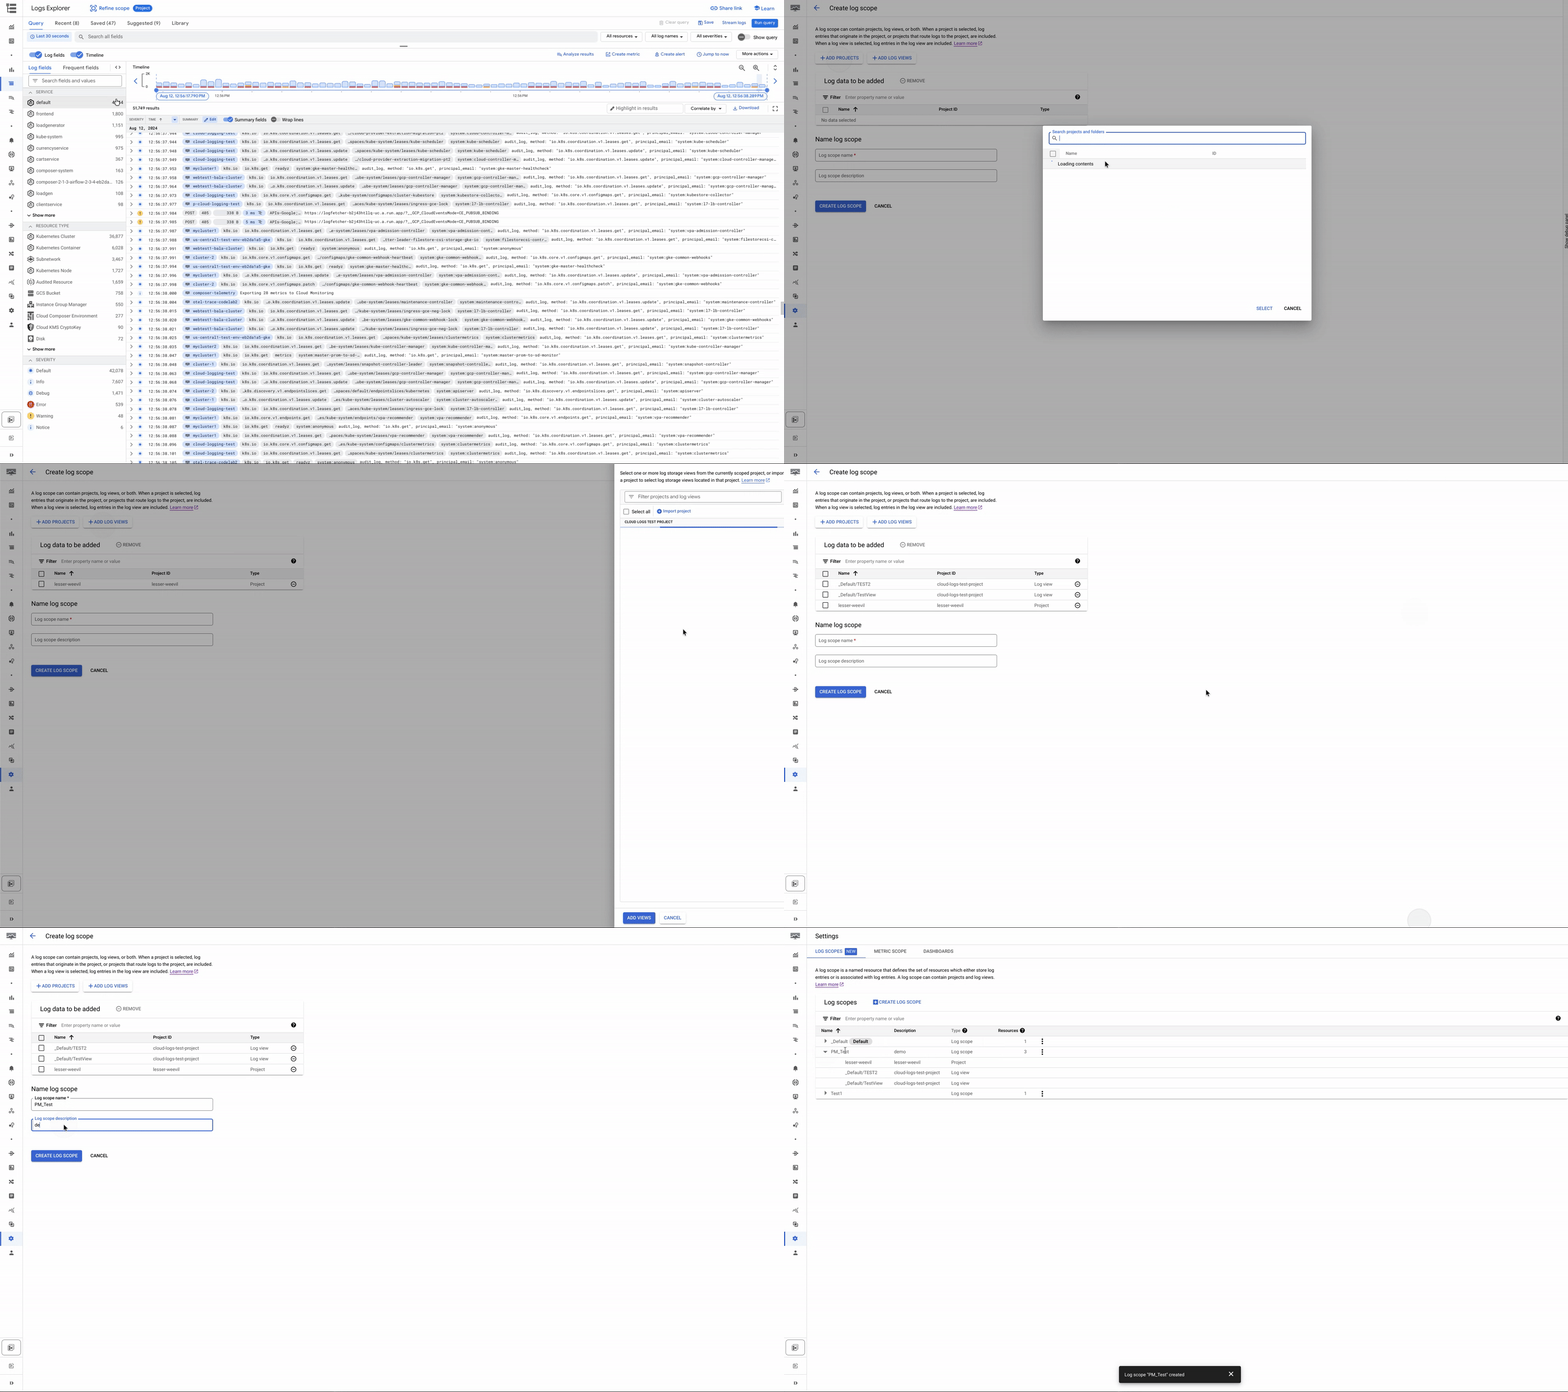

Figure 3 - UI creation flow for a log scope
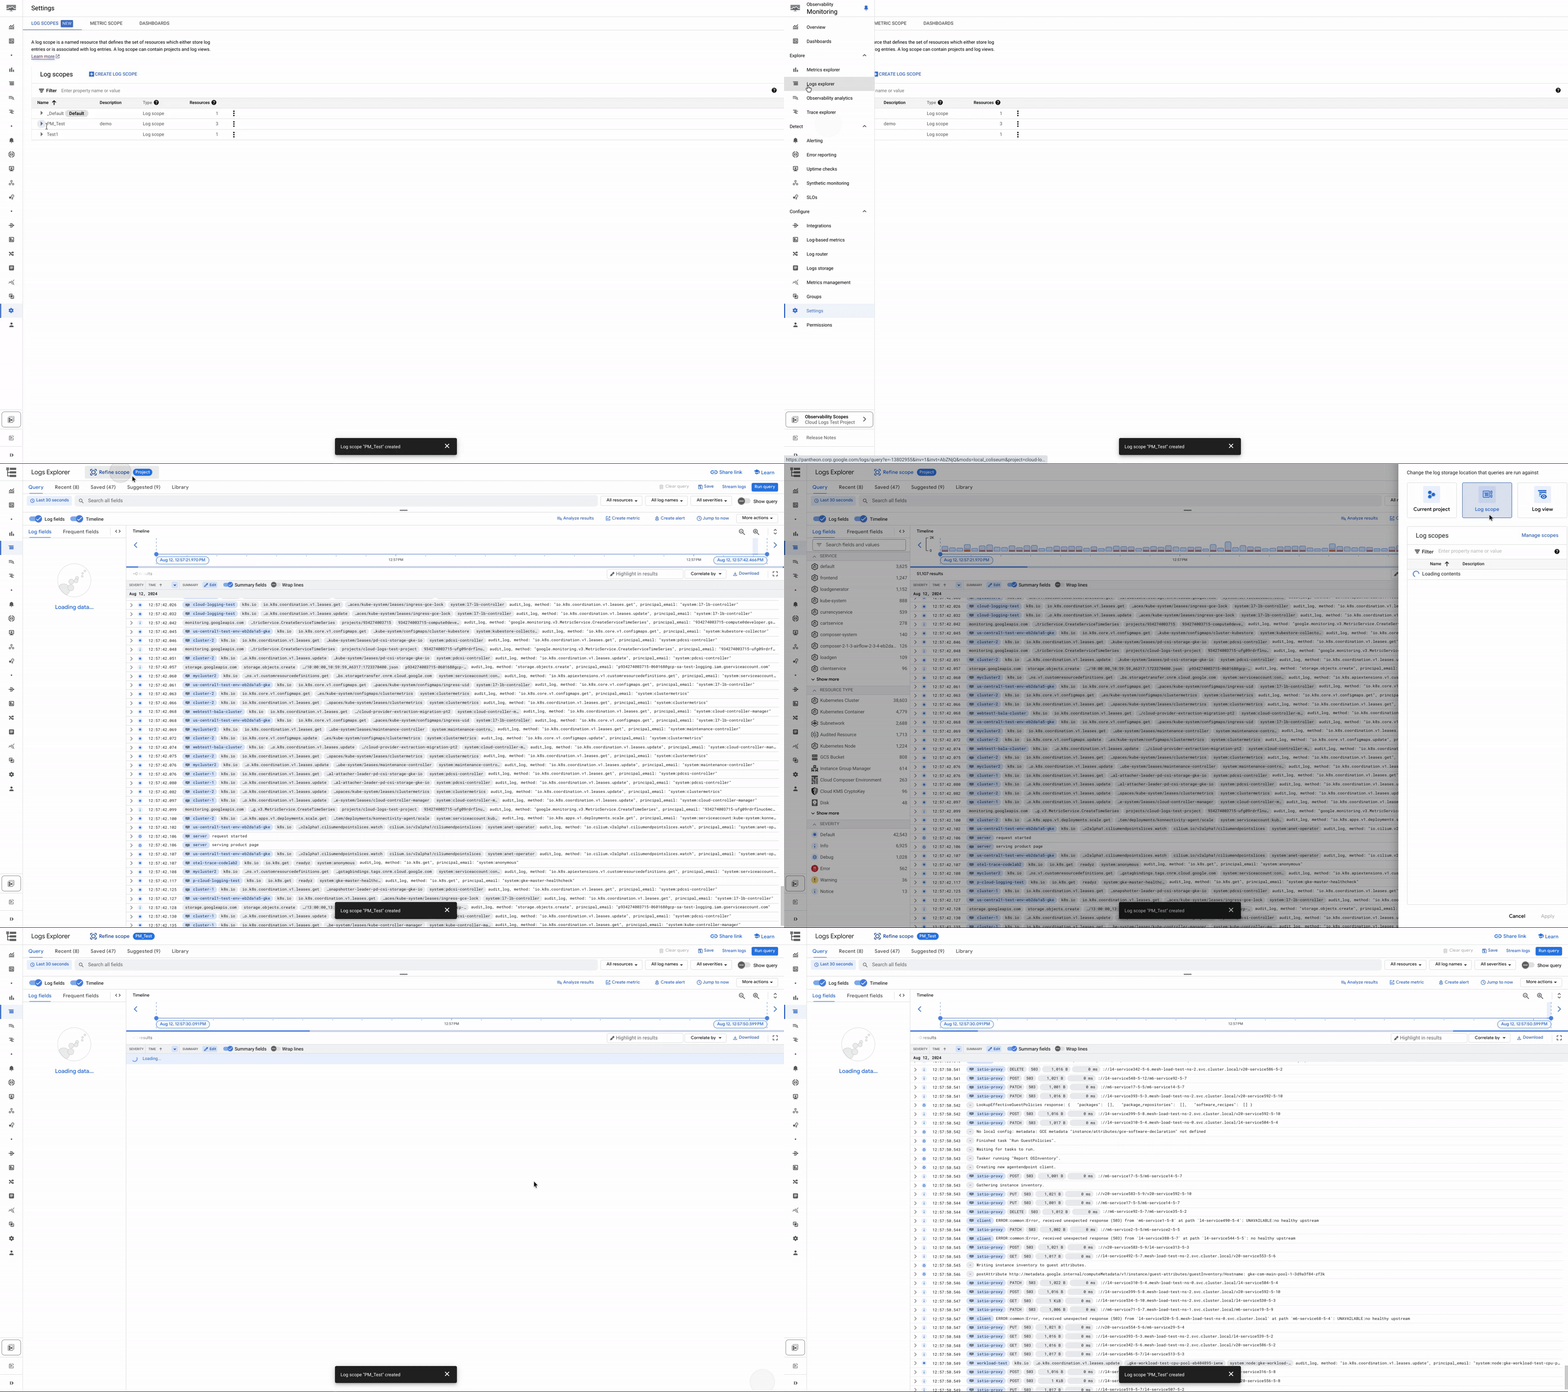

Figure 4 - Log Scope selection flow in Logs Explorer
Stay tuned for future updates as we expand the capabilities of Cloud Logging log scope and integrate them with even more Google Cloud services!
Nicholas Cochrane also contributed to this blog post.
Posted in 4 months ago
37