 9 months ago
57
9 months ago
57
For the most severe threat scenarios, you want multiple layers of automated defenses, and not have to rely on humans to analyze the traces of an attack weeks after your system got compromised. Many security teams use runbooks to glue together tools, processes, events, and actions for security incident response. A runbook lays out the step-by-step instructions to follow when a security incident happens, when an emerging threat surfaces, or when your security tool reports suspicious behavior.
But runbooks that stitch together glamorous security tooling are merely decorations without automated workflows for incident detection and response.
The security community agrees on many high-level best practices in such situations, but we need a single platform solution to orchestrate application security, observability, and DevOps practices. Because every situation is a little unique, Dynatrace makes it easy to create custom runbooks using Dynatrace Automations, fine-tuned to your individual business risks.
In this blog post, we’ll demonstrate how to use Dynatrace Automations to build a runbook that combats sophisticated security incidents with honeytokens and eBPF-based detection. We show an end-to-end solution, starting with deploying policies in a Kubernetes cluster and ending in a pull request assigned to the responsible team, all without manual intervention.
To demonstrate the integration of external security tools into the Dynatrace platform, we use Tetragon for eBPF-based security monitoring. Using Kyverno, we can automatically kick attackers out of our cluster with network policies and harden our configuration with a GitOps workflow to prevent the same incident from happening again.
Better, faster application protection and security investigation
Defending against threats in cloud-native environments requires advanced capabilities that can provide insight into runtime application details and speed up evidence-driven security investigations, such as:
- Runtime Vulnerability Analytics detects and analyzes vulnerabilities in the third-party dependencies of your applications, assisting you in reducing your overall risk profile.
- Runtime Application Protection defends your applications from the inside against injection attacks, even novel yet unseen zero-day attacks.
- The Security Investigator app helps security operators and security analysts to speed-up threat hunting and incident resolution, without losing data context.
Incident response and security investigations often require numerous manual steps. There is sufficient potential to automate many elements of this process. To demonstrate, we explore the following security nightmare:
- An attacker exploited a vulnerability, breached our perimeter without setting off any alerts, and managed to get access to the file system of one of our application containers.
- The attacker is now roaming freely in our container, searching for secrets in sensitive configuration files and abusing them to escalate privileges, move laterally to neighboring systems, or plant malware in our container.
- Unfortunately, we forgot to follow Kubernetes security best practices, such as using role-based access control (RBAC), deploying network policies, and setting the security context.
We’re going to write an automated workflow to detect and respond to this incident as it unfolds.
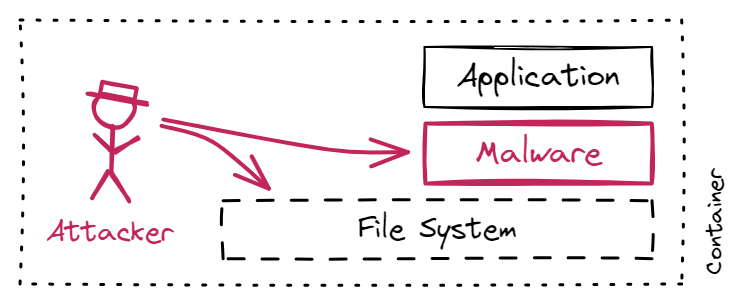 Figure 1: How an attacker gains access to our application container
Step 1: Automating the placement of honeytokens to create strong indicators of compromise
In this sophisticated threat scenario, we don’t know exactly what events or indicators of compromise we should be looking for. Thus, we turn to a slightly different strategy: Setting up traps for attackers. We know that an attacker eventually looks for interesting files in our container. So, let’s provide some interesting files as a lure. This honeytoken strategy levels the playing field. Usually, defenders must attempt to close all security holes while attackers only need to find one open hole. With our honeytoken strategy, attackers must watch their steps not to trip over our traps.
As a lure, we place an s3_token file in path /run/secrets/eks.amazonaws.com/, which is one location for secrets that attackers commonly visit when attacking Amazon EKS clusters. When they try to access the file, it will generate an alert.
We use Kyverno, a popular policy management solution for Kubernetes, to automatically generate and mount this honeytoken into every new container in our Kubernetes cluster. Here’s the Kyverno policy YAML file we can use:
# kyverno-policy.yaml # apiVersion: kyverno.io/v1 kind: ClusterPolicy metadata: name: generate-honeytoken spec: # policy also applies to existing namespaces generateExisting: true rules: - name: generate-honeytoken match: any: - resources: kinds: - Namespace exclude: any: - resources: namespaces: - default - kyverno - kube-system - kube-public context: - name: random-token variable: jmesPath: random('[a-z0-9]{6}') generate: kind: Secret apiVersion: v1 name: honeytoken namespace: "{{request.object.metadata.name}}" # if the policy is deleted, also delete secrets synchronize: true data: data: token: "{{ random('[a-z0-9]{16}') | base64_encode(@) }}" --- apiVersion: kyverno.io/v1 kind: ClusterPolicy metadata: name: mount-honeytoken spec: rules: - name: mount-honeytoken match: any: - resources: kinds: - Pod mutate: patchStrategicMerge: spec: volumes: # depends on the generate-honeytoken policy - name: honey-volume secret: secretName: honeytoken containers: # match any image - (image): "*" volumeMounts: - name: honey-volume readOnly: true subPath: token mountPath: /run/secrets/eks.amazonaws.com/s3_tokenSave this to file kyverno-policy.yaml and apply it in your cluster:
kubectl apply -f kyverno-policy.yamlAfter applying those two cluster policies, we already solved a big pain of deception technology: The highly labor-intensive and tedious deployment of honeytokens that is often configured and maintained manually.
Step 2: Alerting with automated context enrichment
Placing honeytokens is only half of the story. We also need to receive alerts when attackers access our honeytokens. In our scenario, we chose Tetragon to detect read attempts on our honeytoken. Tetragon is a popular eBPF-based security tool for composing sophisticated security policies. We only need two policies for our case, but software engineers Kornilios Kourtis and Anastasios Papagiannis illustrate advanced techniques for file monitoring with eBPF and Tetragon in their blog post.
In our scenario, we only need two tracing policies: One to detect access attempts to the honeytoken file and one to track TCP connections, so we also find the attacker’s IP address.
# tetragon-policy.yaml # # This file was originally authored by Tetragon developers and adapted by Dynatrace. # - https://github.com/cilium/tetragon/blob/main/examples/tracingpolicy/filename_monitoring.yaml # - https://github.com/cilium/tetragon/blob/main/examples/tracingpolicy/tcp-connect.yaml # apiVersion: cilium.io/v1alpha1 kind: TracingPolicy metadata: name: monitor-honeytoken spec: kprobes: - call: security_file_permission syscall: false return: true args: # (struct file *) used for getting the path - index: 0 type: file # 0x04 is MAY_READ, 0x02 is MAY_WRITE - index: 1 type: int returnArg: index: 0 type: int returnArgAction: Post selectors: - matchArgs: - index: 0 operator: Prefix values: - /run/secrets/eks.amazonaws.com/s3_token --- apiVersion: cilium.io/v1alpha1 kind: TracingPolicy metadata: name: monitor-tcp-connect spec: kprobes: - call: tcp_connect syscall: false args: - index: 0 type: sockSave this to file tetragon-policy.yaml and apply it in your cluster:
kubectl apply -f tetragon-policy.yamlEnable the automatic ingest of Tetragon alerts to Dynatrace
We already installed Dynatrace on Kubernetes so that OneAgent automatically picks up logs from our cluster. Tetragon emits alerts using a shell process, which is typically noisy and not monitored in Dynatrace by default. To enable Dynatrace to automatically capture Tetragon logs in Dynatrace, navigate to Settings > Processes and containers > Declarative process grouping and add a new monitored technology for the Tetragon export-stdout process group:
- Process group display name: export-stdout
- Process group identifier: export-stdout
- Report process group: Always
- Detection rule > Select process property: Command line
- Detection rule > Condition: $contains(export-stdout)
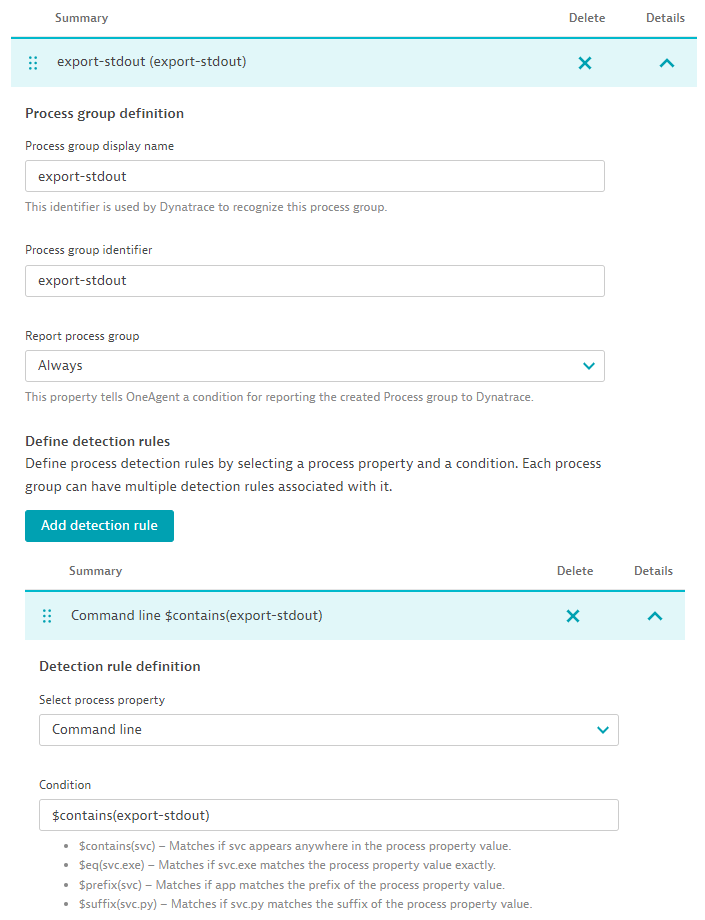 Figure 2: Enable Dynatrace to automatically capture Tetragon logs
To test if this setup is working, we open a shell in any of our containers and try reading the honeytoken that Kyverno previously placed. The honeytoken is only available in pods created after we apply the Kyverno policy.
kubectl exec -it -n your-namespace-name your-pod-name -- /bin/bash $ cat /run/secrets/eks.amazonaws.com/s3_token dyxt57xkazpw1cj5Then, we open the Security Investigator app or the Notebooks app to track down the expected policy violation in Dynatrace:
fetch logs, from: now() - 1h | filter k8s.deployment.name == "tetragon" | parse content, "JSON:content" | filter content[process_kprobe][policy_name] == "monitor-honeytoken" | fields timestamp, content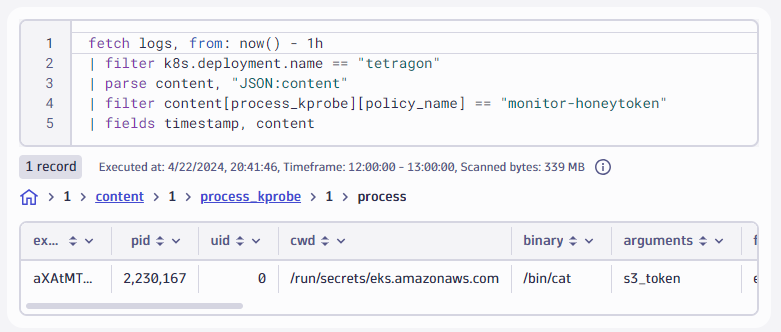 Figure 3: Query Tetragon events using DQL
Great, we spotted this indicator of compromise!
We want to automatically react to such intrusion alerts to reduce the burden on the incident response team. With the Dynatrace Platform, you can manage such security runbooks in a central and unified way.
Let’s assume an attacker tripped over our trap by reading the honeytoken. As a next step, we leverage the deep, context-aware observability insights Dynatrace has collected, block the attacker’s IP address, and inform the security team. Here’s an automation workflow that executes the following in order:
- Listen for recent token access alerts using Dynatrace Query Language (DQL).
- Correlate the alerts with logs on TCP connection events to find the attacker’s IP address.
- Identify the owners of the affected resource and its associated source code repository.
- Create a pull request in that repository that sets a new security policy to block the attacker’s IP address.
- Create a ticket for the security team to follow-up on that incident.
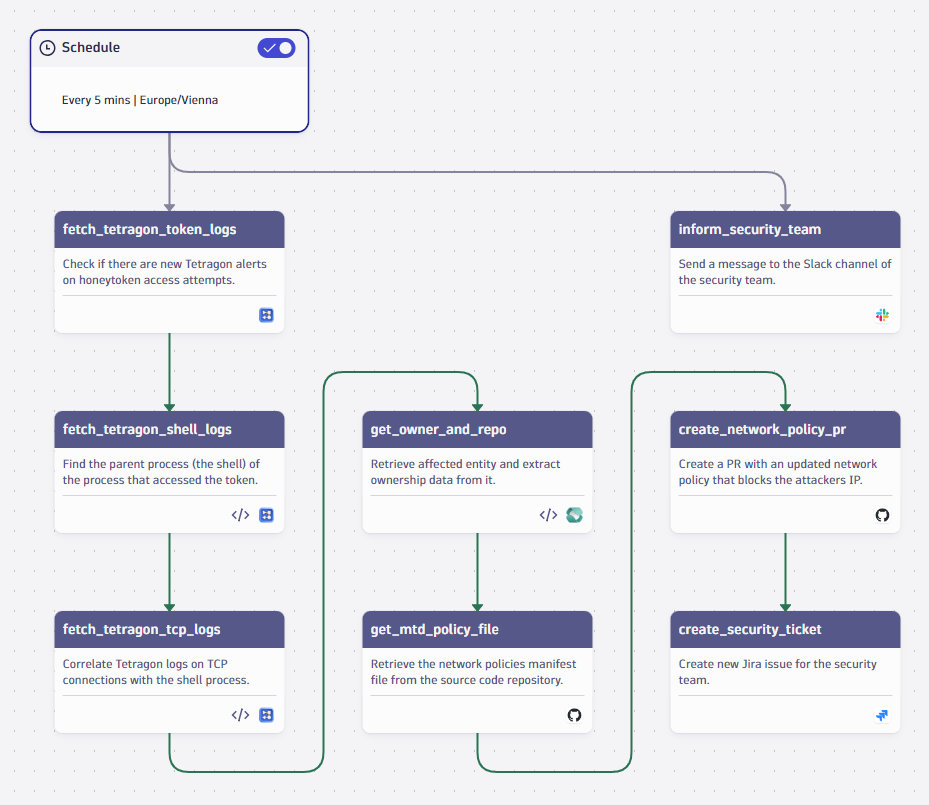 Figure 4: Context aware security incident response
Correlating token access alerts and network connections
The Tetragon alert on honeytoken access can’t provide the IP address of the related network session. But we can look for the parent process that established the TCP connection. Attackers rarely connect “directly” to your infrastructure; no port would be open to accept such a connection anyway. Instead, connections are established the other way around: Attackers connect from inside your infrastructure to their remote server, often referred to as the command-and-control (CnC) server. This attack technique is called opening a “reverse shell”. The resulting process tree typically consists of three processes: The malware itself, the shell it spawns, and the process that accesses the honeytoken.
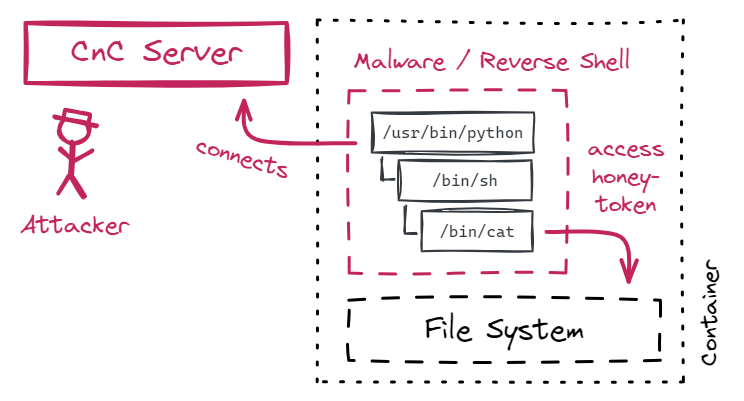 Figure 5: Reverse shell attack technique process tree
With just three DQL queries, we find the attacker’s IP address. Note that the following queries target the structure of this attack technique and don’t hard-code process names, which attackers can easily change.
- The first query finds the low-level process that accessed the honeytoken, for example, /bin/cat. We return the execution ID of its parent process, that is, the shell that called /bin/cat. fetch logs, from: now() - 10m | filter k8s.deployment.name == "tetragon" | parse content, "JSON:content" | filter content[process_kprobe][policy_name] == "monitor-honeytoken" | fields timestamp, {content[node_name], alias: node_name}, {content[process_kprobe][parent][exec_id], alias: parent_exec_id}
- The second query finds the shell (for example, /bin/sh) by its execution ID. The only reason for this query is to get the execution ID of the shell’s parent process, that is, the process that initially spawned the shell. fetch logs, from: now() - 10m | filter k8s.deployment.name == "tetragon" | parse content, "JSON:content" | filter content[node_name] == {{ result("fetch_tetragon_token_logs").records[0].node_name }} | filter content[process_exec][process][exec_id] == {{ result("fetch_tetragon_token_logs").records[0].parent_exec_id }} | fields timestamp, {content[node_name], alias: node_name}, {content[process_exec][parent][exec_id], alias: parent_exec_id}
- The third query finds processes that established network connections (for example, /usr/bin/python if the malware was written in Python) and filters on the execution ID returned from the previous query. The malware that spawned the shell also established the network connection. The Tetragon event also holds the remote IP address of the attacker’s server. fetch logs, from: now() - 10m | filter k8s.deployment.name == "tetragon" | parse content, "JSON:content" | filter content[node_name] == {{ result("fetch_tetragon_shell_logs").records[0].node_name }} | filter content[process_kprobe][policy_name] == "monitor-tcp-connect" | filter content[process_kprobe][function_name] == "tcp_connect" | filter content[process_kprobe][process][exec_id] == {{ result("fetch_tetragon_shell_logs").records[0].parent_exec_id }} | fields timestamp, {content[process_kprobe][args][0][sock_arg][daddr], alias:daddr}, {content[process_kprobe][process][pod][name], alias:pod_name}, {content[process_kprobe][process][pod][namespace], alias:pod_namespace}, {content[process_kprobe][process][pod][pod_labels], alias:pod_labels}, {dt.entity.cloud_application_namespace, alias:namespace_id}
At this point, we got the intrusion event, and we got the attacker’s IP address. A typical security solution might create a generic security problem and assign it to – well, who? – some overworked security engineer who then has to dig up the component’s owner.
Automatically assigning tickets and pull requests to the correct developer teams
There is a better way: In the Kubernetes app, we can set ownership tags on our workloads. A best practice is to label your workloads already when you deploy them. A workflow action then finds the team responsible for this component and their source code repository. For demonstration, we close the loop with two more workflow actions:
- We open a pull request in the affected repository to create a network policy that blocks the attacker from accessing the cluster again based on the remote IP address Tetragon detected.
- We create a security ticket, notably, with full context information, and assigned to the correct team.
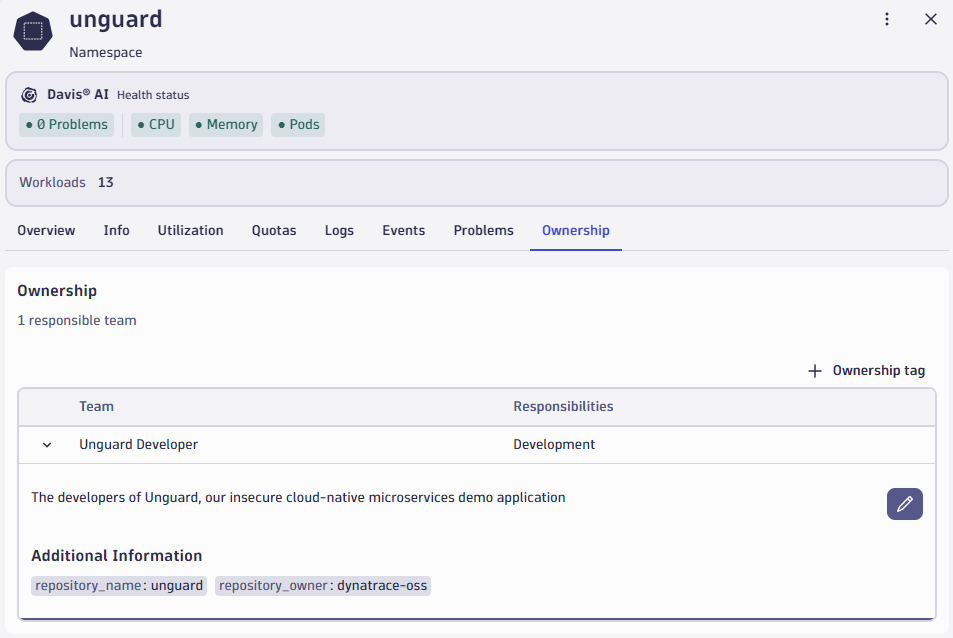 Figure 6: Ownership tags on the Kubernetes namespace
Bonus step: Deploying the security policy into the live cluster
The previous workflow follows the GitOps pattern for security remediation. That means we auto-create a pull request with a new security policy and let the developers review it. This creates a well-defined audit trail and avoids unintended disruption of live workloads.
Under some circumstances, you might want to kick out attackers as soon as you can, without any human intervention. We can utilize the newly introduced Kubernetes actions to perform cluster operations directly. We adapt the workflow as follows:
- Directly deploy the security policy to the cluster, in addition to creating the pull request.
- Possibly delete the pod on which we spotted the attacker to avoid further harm.
Deleting a pod sounds drastic, but if your environment is configured in a resilient manner, for example, if your application can tolerate a brief outage of some of its services, it’s a “cloud native strategy” to kick out an attacker. The Kubernetes control plane automatically re-creates a fresh (and uninfected) pod within seconds.
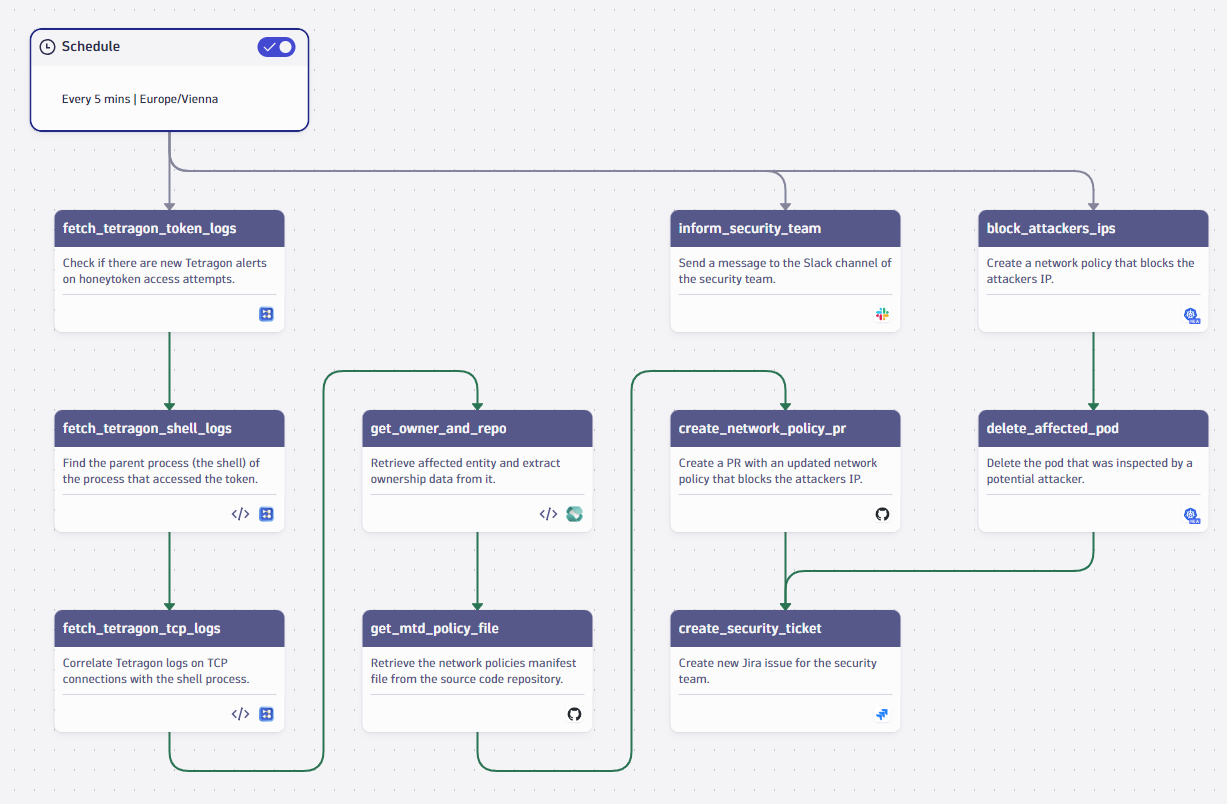 Figure 7: Kubernetes control plane automatically recreates a fresh and uninfected pod
Workflows for security incident response on the Dynatrace platform
We demonstrated how to create a security runbook with Dynatrace Automations, orchestrating external security alerts, and custom processes:
- Tetragon as our source for eBPF-based security events.
- Kyverno to manage policies in Kubernetes.
- Grail as our storage for logs and events, which we query using the Dynatrace Query Language (DQL).
- Ownership tags to identify responsible developer teams.
- Jira and Slack integrations for workflows.
- Available soon: GitHub actions to automatically create pull requests with new security policies in the correct repository.
- Available soon: Kubernetes actions to make urgent changes to the live cluster directly.
Your tech stack might be different, your security runbooks might be different, your risk profile might be different, but with the unique, context-specific insights and automation capabilities of the Dynatrace platform, you can implement and automate it all easily and flexibly.