Written by: Soufiane Fariss, Willi Ballenthin, Mike Hunhoff, Genwei Jiang, Tina Johnson, Moritz Raabe
capa, developed by Mandiant's FLARE team, is a reverse engineering tool that automates the identification of program capabilities. In this blog post we introduce capa Explorer Web, a browser-based tool to display the capabilities found by capa. The capa Explorer Web UI provides an intuitive and interactive way to visualize the capa analysis results.
This feature was implemented by Soufiane Fariss (@s-ff) as part of the Google Summer of Code (GSoC) project that the Mandiant FLARE team mentored in 2024.
Background
capa analyzes programs using various backends, such as IDA Pro, Ghidra, and CAPE, to extract features. Then it identifies capabilities by matching these features against rules written by experts. A program matches a capability rule when its extracted features match the set of conditions declared in the rule.
Before the release of capa Explorer Web, the capa Explorer IDA plugin was the only way to interactively explore capa rule matches. Analysts without access to IDA Pro had no graphical interface to easily inspect capa results. Due to the large amount of data this was especially a shortcoming for the exploration of dynamic results, a feature introduced in capa v7.0 for detecting capabilities from sandbox traces.
Introducing capa Explorer Web
capa Explorer Web offers an intuitive and interactive visualization of capa analysis results. Users can browse rule matches and understand the reasoning behind them. Analysts can sort, search, and filter results. The interface offers different views including a table view with rule match details (see Figure 1), a function-centric view for static analysis, and a process-tree view for dynamic analysis results.
Getting Started
capa Explorer Web is accessible online at our GitHub page, and you can start analyzing capa results immediately (see Figure 2). For offline usage, you can download a standalone HTML file from the website. Similar to CyberChef, it is an HTML file that can be opened locally in a browser and works without an Internet connection.


Figure 2: capa Explorer Web home page
To generate a capa result document, follow these quick steps to get started:
-
Install capa, e.g. download the latest standalone executable release
-
Analyze a sample and save the JSON results: capa.exe -j /path/to/file > result.json
-
Load the JSON results file into capa Explorer Web
Loading capa Results
capa Explorer Web allows you to load capa result documents from local JSON files, including Gzipped files. All processing occurs in your browser – no data is transferred to any server.
Default Table View Showing Rule Match Details
The default web UI displays identified program capabilities in a rule match table. Users can expand, sort, filter, and search rule match details (see Figure 3). This enables analysts to triage samples faster. The table shows detailed information for each rule match – including matched features and their addresses. Users can also view and filter on rule meta information like namespaces, associated MITRE ATT&CK techniques, and Malware Behavior Catalog classifications (MBC).
Figure 3 illustrates how an analyst can use capa Explorer Web to study the details of a rule match. Expanding the “inject APC” match row shows which features capa identified including their location in the program. This insight can streamline the identification of key behaviors and further support additional analysis – for example, when inspecting sandbox traces, debugging a sample, or analyzing the disassembled file.


Figure 3: Static analysis results in capa Explorer Web
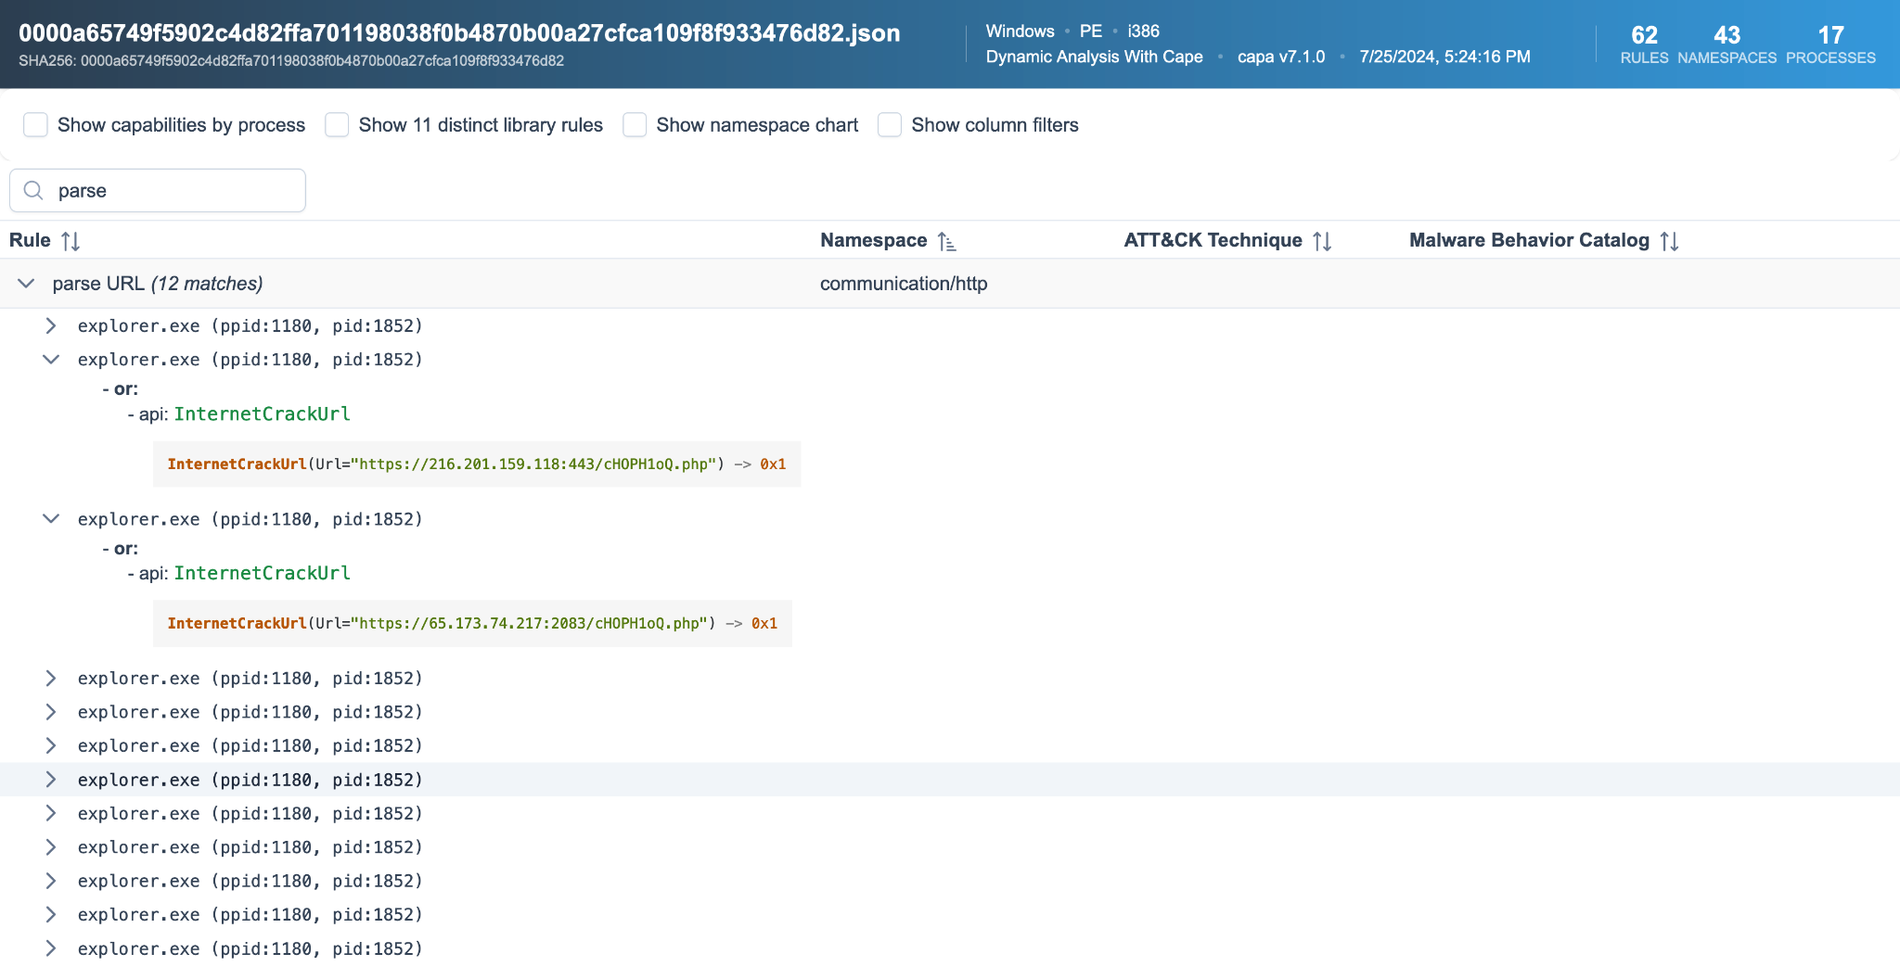
Figure 4 demonstrates how analysts can leverage capa's dynamic analysis results to identify suspicious processes which exhibit malicious behavior. For instance, the process "explorer.exe" (a seemingly benign name) is shown invoking the InternetCrackUrl API with potentially malicious URLs as arguments, such as hxxps://216.201.159[.]118:443/cHOPH1oQ.php. This noteworthy functionality hints at possible process injection, and here even provides potential network-based indicators for further analysis.


Figure 4: Dynamic analysis results in capa Explorer Web
Rule Match Context
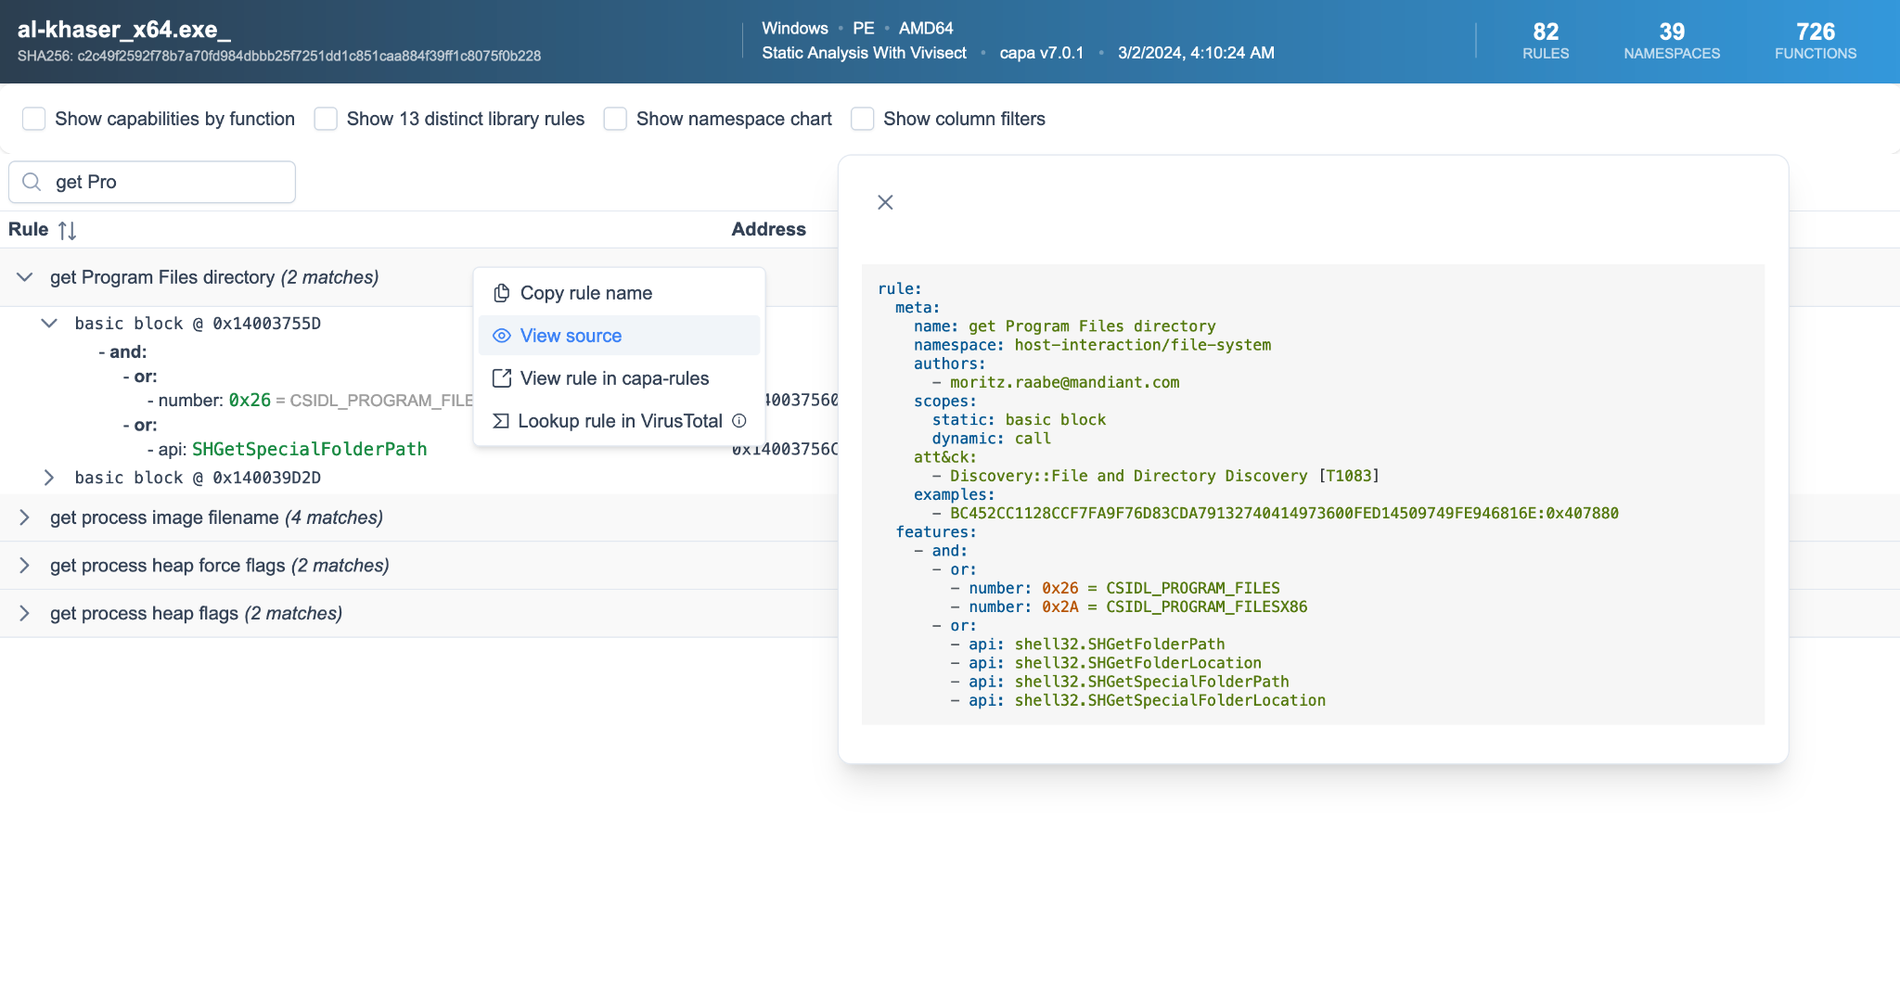
Via right-click on a match row users can access additional explorer functionality. This includes viewing the rule source definition as shown in Figure 5, opening the rule definition in the capa rules website, or searching for samples with this capability in VirusTotal to gain broader threat intelligence insights. The VirusTotal lookup requires a premium account.


Figure 5: Inspecting the source logic via the rule match context menu
Alternative Views Grouping Functions and Processes
The function and process capability views in capa Explorer Web offer granular insights into program functionality, organized by their location within the analyzed sample. For static analysis results, the function capabilities view groups rule matches by function address, allowing reverse engineers to quickly identify functions with key behavior (see Figure 6).


Figure 6: Static analysis results grouped by function
For dynamic analysis results, the process capabilities view organizes matches by process in a tree structure, showing Process ID (PID) and Parent Process ID (PPID) information (see Figure 7). Hovering a process column shows the respective rule matches.


Figure 7: Dynamic analysis results grouped by process
Integrating capa Explorer Web with VirusTotal
capa has been integrated as part of VirusTotal's analysis since January 2023. Our new UI integration enables users to explore capa results directly from VirusTotal. With this you do not need to acquire a sample or analyze it locally with capa. To open capa Explorer Web from VirusTotal navigate to: Behavior > Download Artifacts > Open in CAPA Explorer (see Figure 8) or use Open in CAPA explorer next to Capabilities (see Figure 9). Currently, this feature requires a premium VirusTotal subscription.
Note that not all files have capa analysis results available. capa currently only supports analysis of non-corrupted PE, .NET, and ELF x86/x64 executables.


Figure 8: Access capa Explorer Web analysis from VirusTotal


Figure 9: Alternative link to open capa Explorer Web analysis from VirusTotal
When reviewing a new sample on VirusTotal, an analyst can pivot directly into capa Explorer Web to identify interesting locations within the program. This workflow allows prioritization of functions for deeper code analysis in the preferred reverse engineering tool.
Future Work
For future enhancements of capa Explorer Web, we plan to first enhance the process tree view mode to improve visualization of per-process matches. Additionally, we are considering new views to include extracted Indicators of Compromise (IoCs) for dynamic analysis. This could display extracted indicators such as URLs, file paths, and registry keys to further enhance the triage process. We are looking forward to your feedback and suggestions. Please reach out via our GitHub issues page.
Soufiane’s Google Summer of Code Acknowledgement
Working on Google Summer of Code 2024 expanded my technical skills significantly: I learned new programming languages and frameworks, improved my code review skills, and gained practical experience with CI/CD practices and software distribution.I’d like to thank my mentors for supporting me throughout the whole project. They have been very helpful from the get-go. This project wouldn’t have gone smoothly without their feedback and encouragement.
For future (GSoC) contributors, I recommend: dive deep into the existing codebase, don't hesitate to ask questions, and always share your thoughts with the other collaborators. I'm anticipating the continued evolution of capa and other open source tools. Whether through implementing new features, improving performance, extending file format support, or enhancing visualizations and integrations with other reverse engineering tools; the potential for growth is quite exciting and you can take part in it.
Posted in 3 months ago
23