With the recently released version of the Databases app, Dynatrace allows you to monitor your databases from a query perspective:
- Quickly find all heavy queries that consume your database resources
- Monitor your query metrics and resource utilization
- Understand how your queries are executed through the Query Execution Plan
Optimize application performance: The importance of database analysis
Databases are critical for all (business-critical) applications and significantly affect performance. Monitoring the health and performance of your databases is essential to ensuring optimal application functionality. While infrastructure-level monitoring provides valuable insights, it might not reveal the root causes of database-related slowdowns. To address this, deeper analysis at the query level is necessary. By examining individual queries, you can identify database bottlenecks and implement targeted optimizations.
The Dynatrace Databases app introduces essential query-level monitoring features
The Databases app now offers long-awaited functionality for database monitoring at the query level:
Top Queries view lets you quickly identify queries that take a long time to execute or unnecessarily consume precious database resources. Additionally, it allows you to analyze how resource consumption or performance metrics for a given query have changed over time.
Query execution plans offer even more insights into how a database engine executes queries. Understanding what contributes most to query execution time is essential to query optimization. Instead of experimenting with different optimization techniques, deep analysis of the query execution plan makes pinpointing any possible resource conflicts or service degradations easy.
Top Queries and Execution Plans are available in the Databases app. These functionalities are currently supported for the following database engines:
- Microsoft SQL Server
- Oracle
- PostgreSQL
- MySQL
- MariaDB
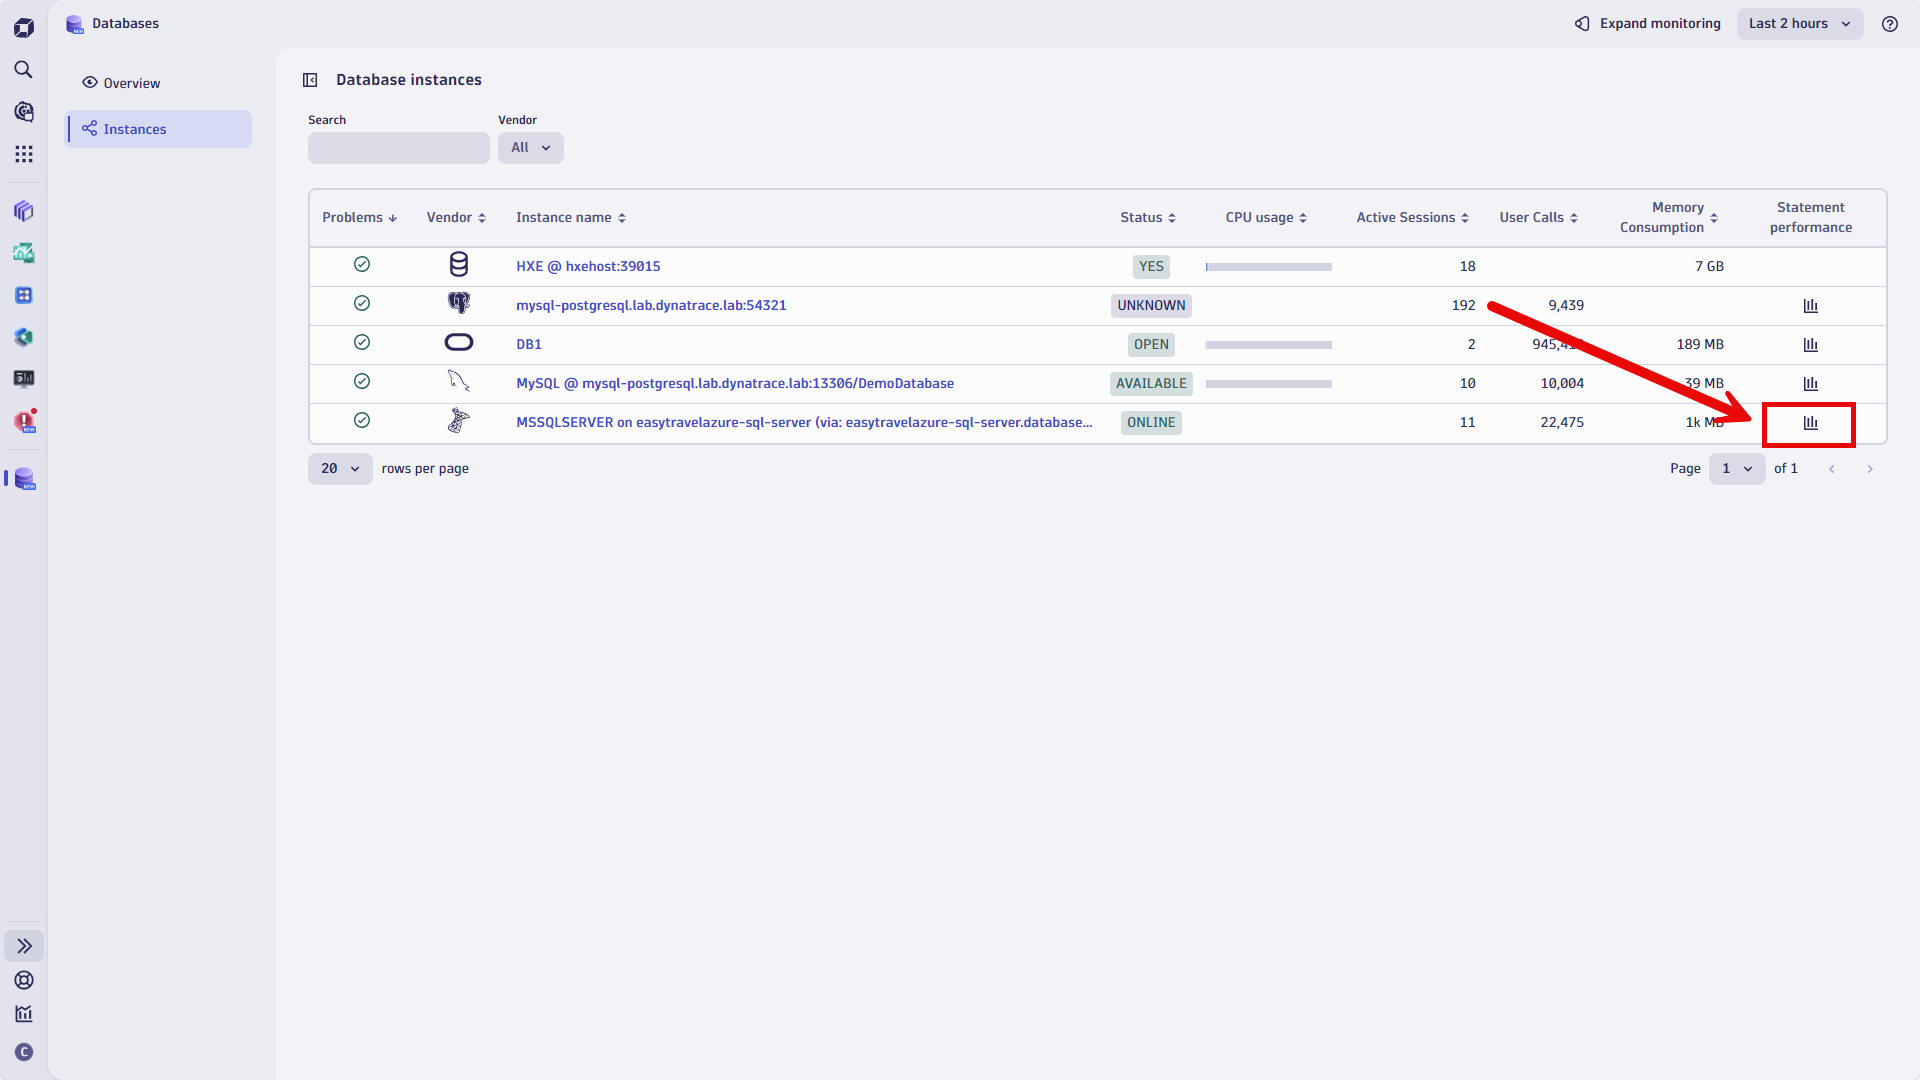
To start your analysis, open Databases, go to Instances > Top Queries and select the Statement Performance button for a specific database instance.
 Figure 1. Databases app: Instances with Statement Performance
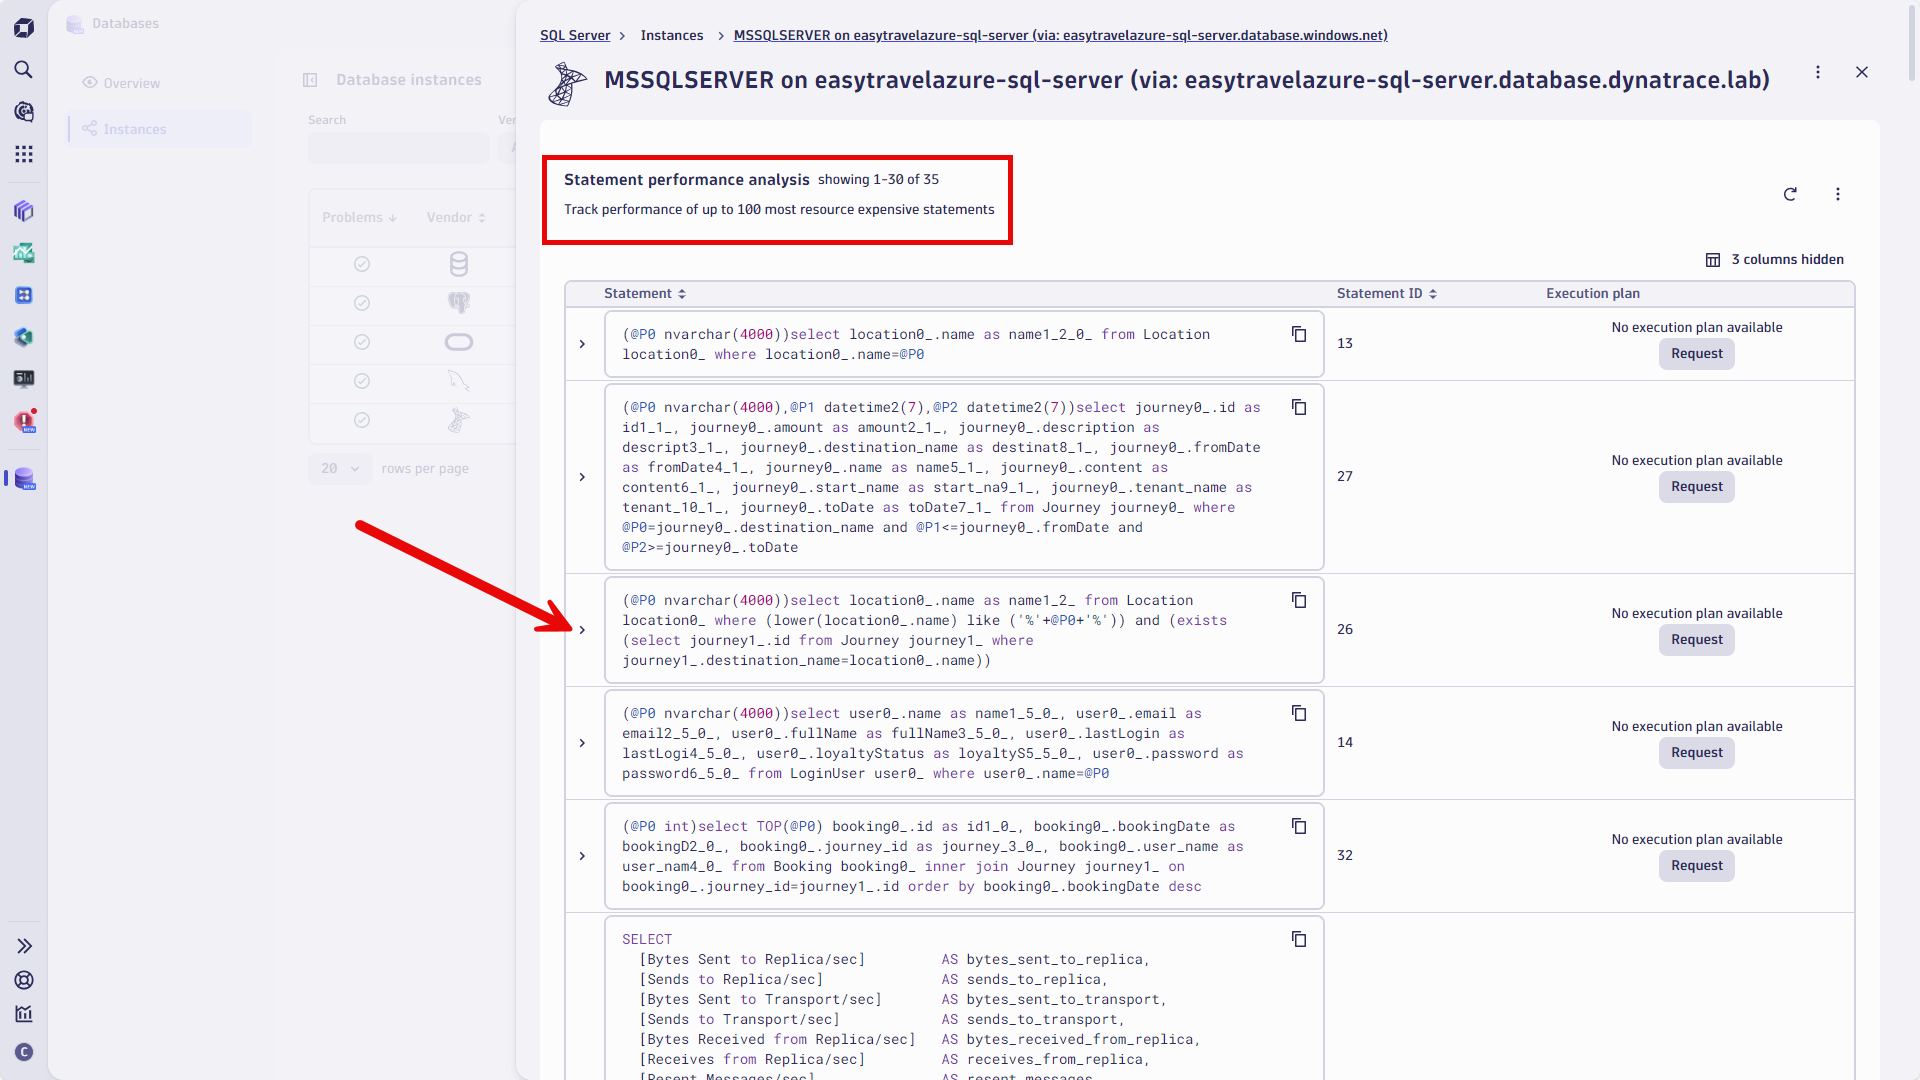
After identifying a query for analysis, you can look for interesting metrics that measure various conditions, like execution time, CPU consumption, or I/O utilization.
 Figure 2. Statement performance analysis
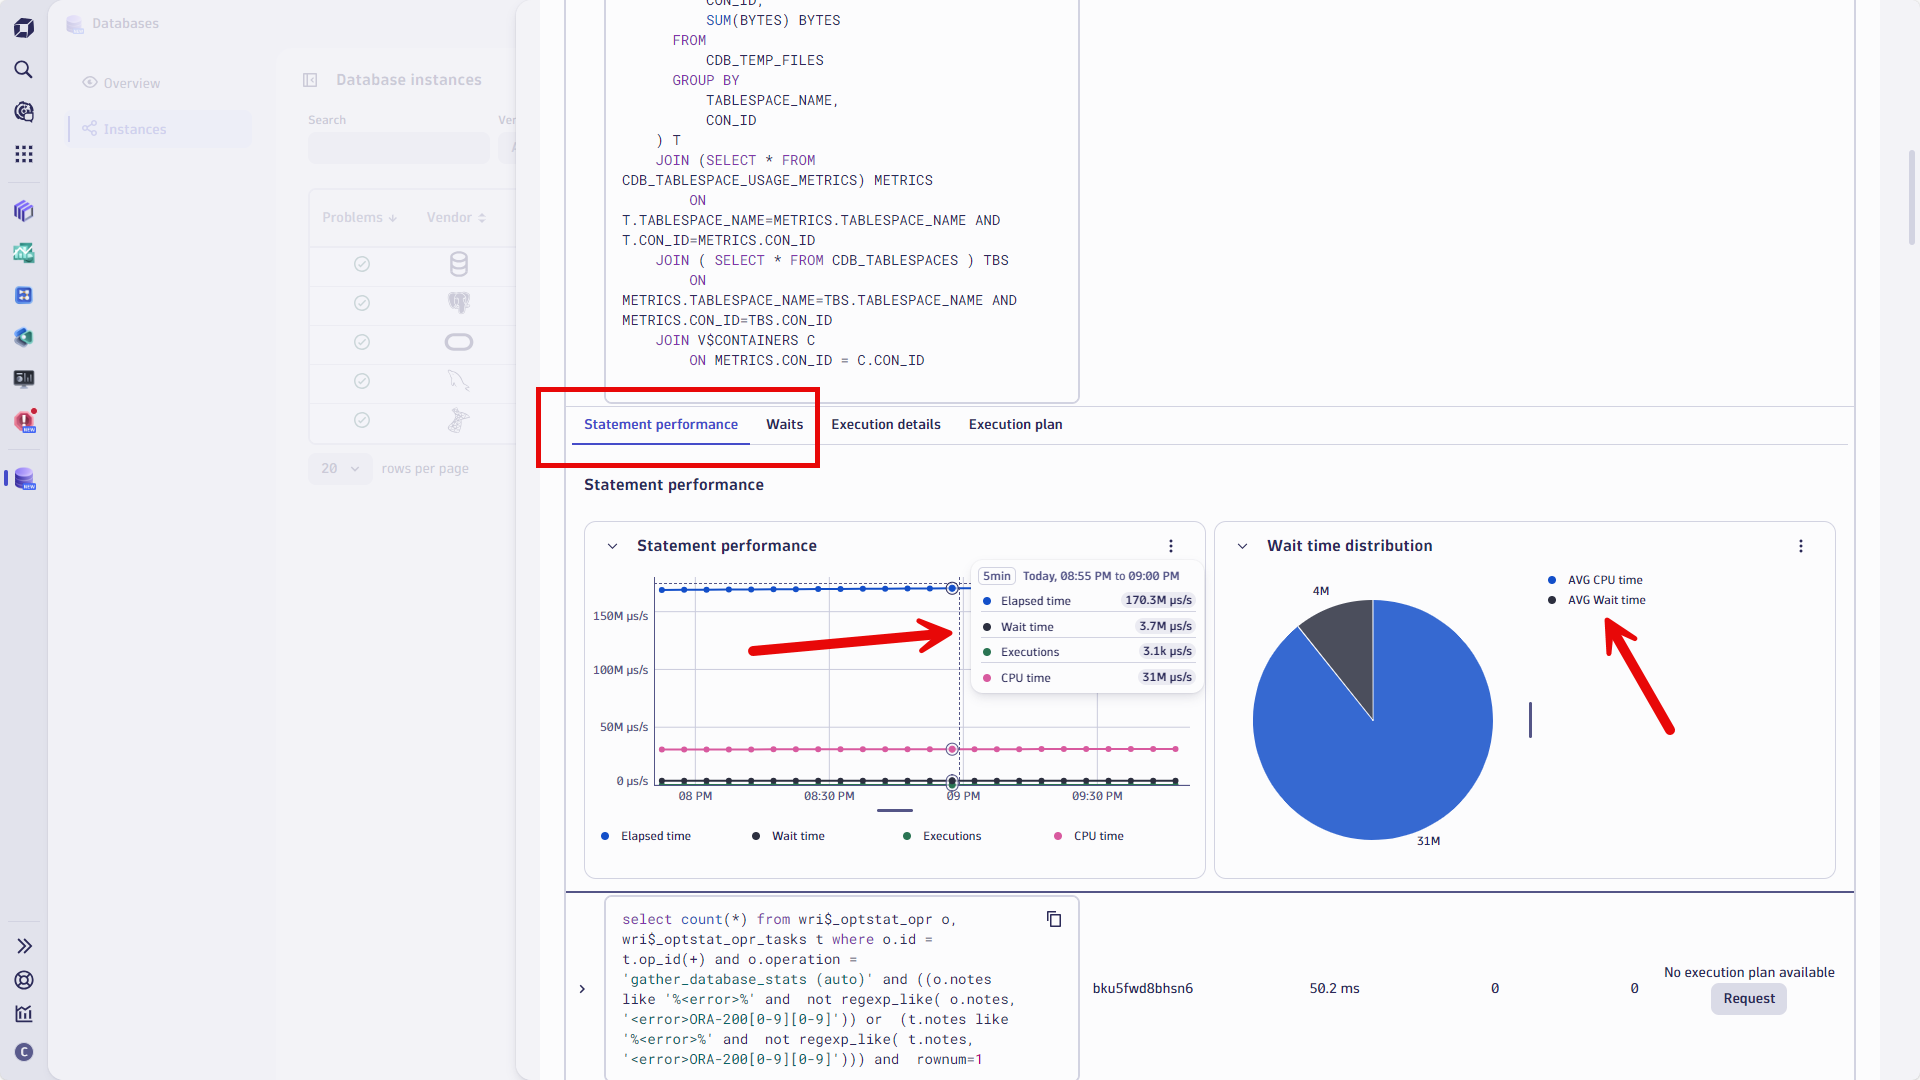
Expanding the query row allows you to analyze query performance over time from various perspectives.
 Figure 3. Analyze queries across multiple perspectives.
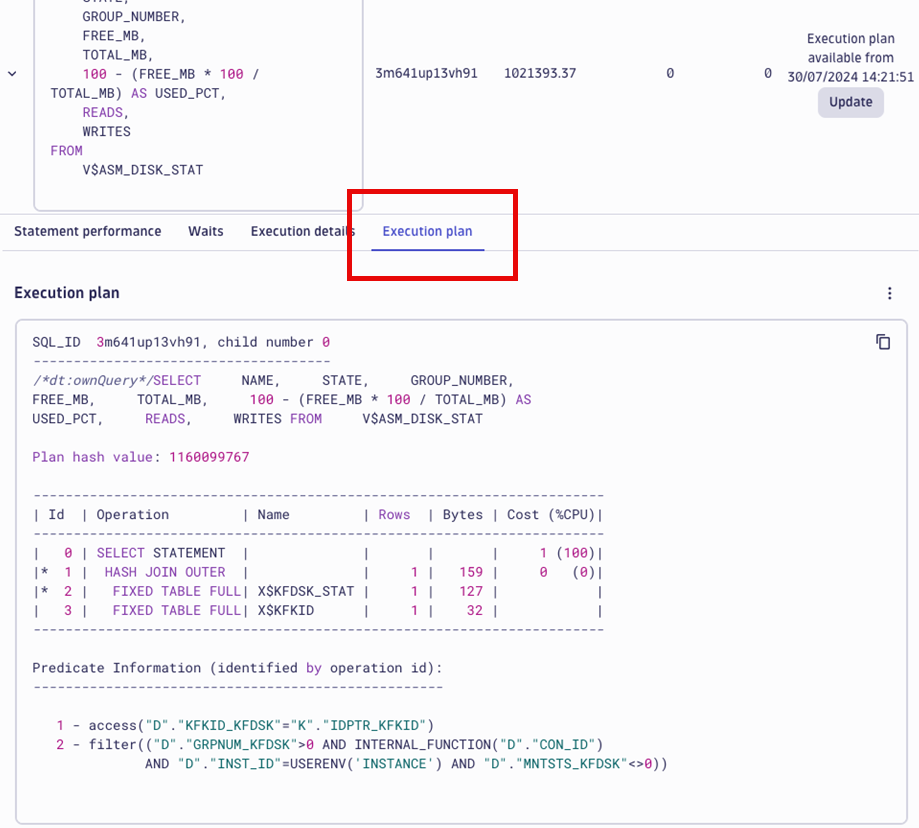
To better understand how the given query is executed and to identify possible optimizations, you can request a query execution plan. Select the Request button and go to the Execution plan tab.
 Figure 4. Query execution plan
Execution plans provide a roadmap for how the database engine executes queries. With access to execution plans, you can identify performance bottlenecks, such as inefficient joins, missing indexes, and long-running queries, and optimize them for better efficiency and performance.
Execution plans also allow you to understand the cost and resource usage of the various query operations involved, enabling informed decisions about query re-design and indexing strategies. You can ensure that your databases run efficiently, and ultimately improve application performance.
Get started with the Databases app
Start monitoring your databases at the query level with the Dynatrace Databases app. Ensure that your databases are not a bottleneck for your apps and that you’re efficiently using database queries with the new and improved query execution plans.
If you have specific improvements in mind or would like to share feedback with us, please visit our Dynatrace Community feedback channel.
 2 weeks ago
3