In today’s complex digital landscape, application teams are buried under a deluge of telemetry data and logs. Traditional monitoring tools struggle to keep up, leaving teams with siloed insights and incomplete visibility. Without a unified view, finding the root cause of performance issues becomes a game of guesswork, slowing down innovation and creating more problems than solutions. That’s why app teams need a streamlined approach to OpenTelemetry™ data that empowers them to cut through the noise and gain actionable insights at scale.
Considering the latest State of Observability 2024 report, it’s evident that multicloud environments not only come with an explosion of data beyond humans’ ability to manage it. It’s increasingly difficult to ingest, manage, store, and sort through this amount of data. According to 85% of tech leaders, organizations also see a substantial rise in complexity caused by increased tool volume. This results in a siloed view of data, hindering team collaboration, making it more difficult to get to the root cause of a problem, and increasing inefficiencies. Teams need a better way to work together, eliminate silos and spend more time innovating.
Enhanced data collection with the Dynatrace Otel Collector
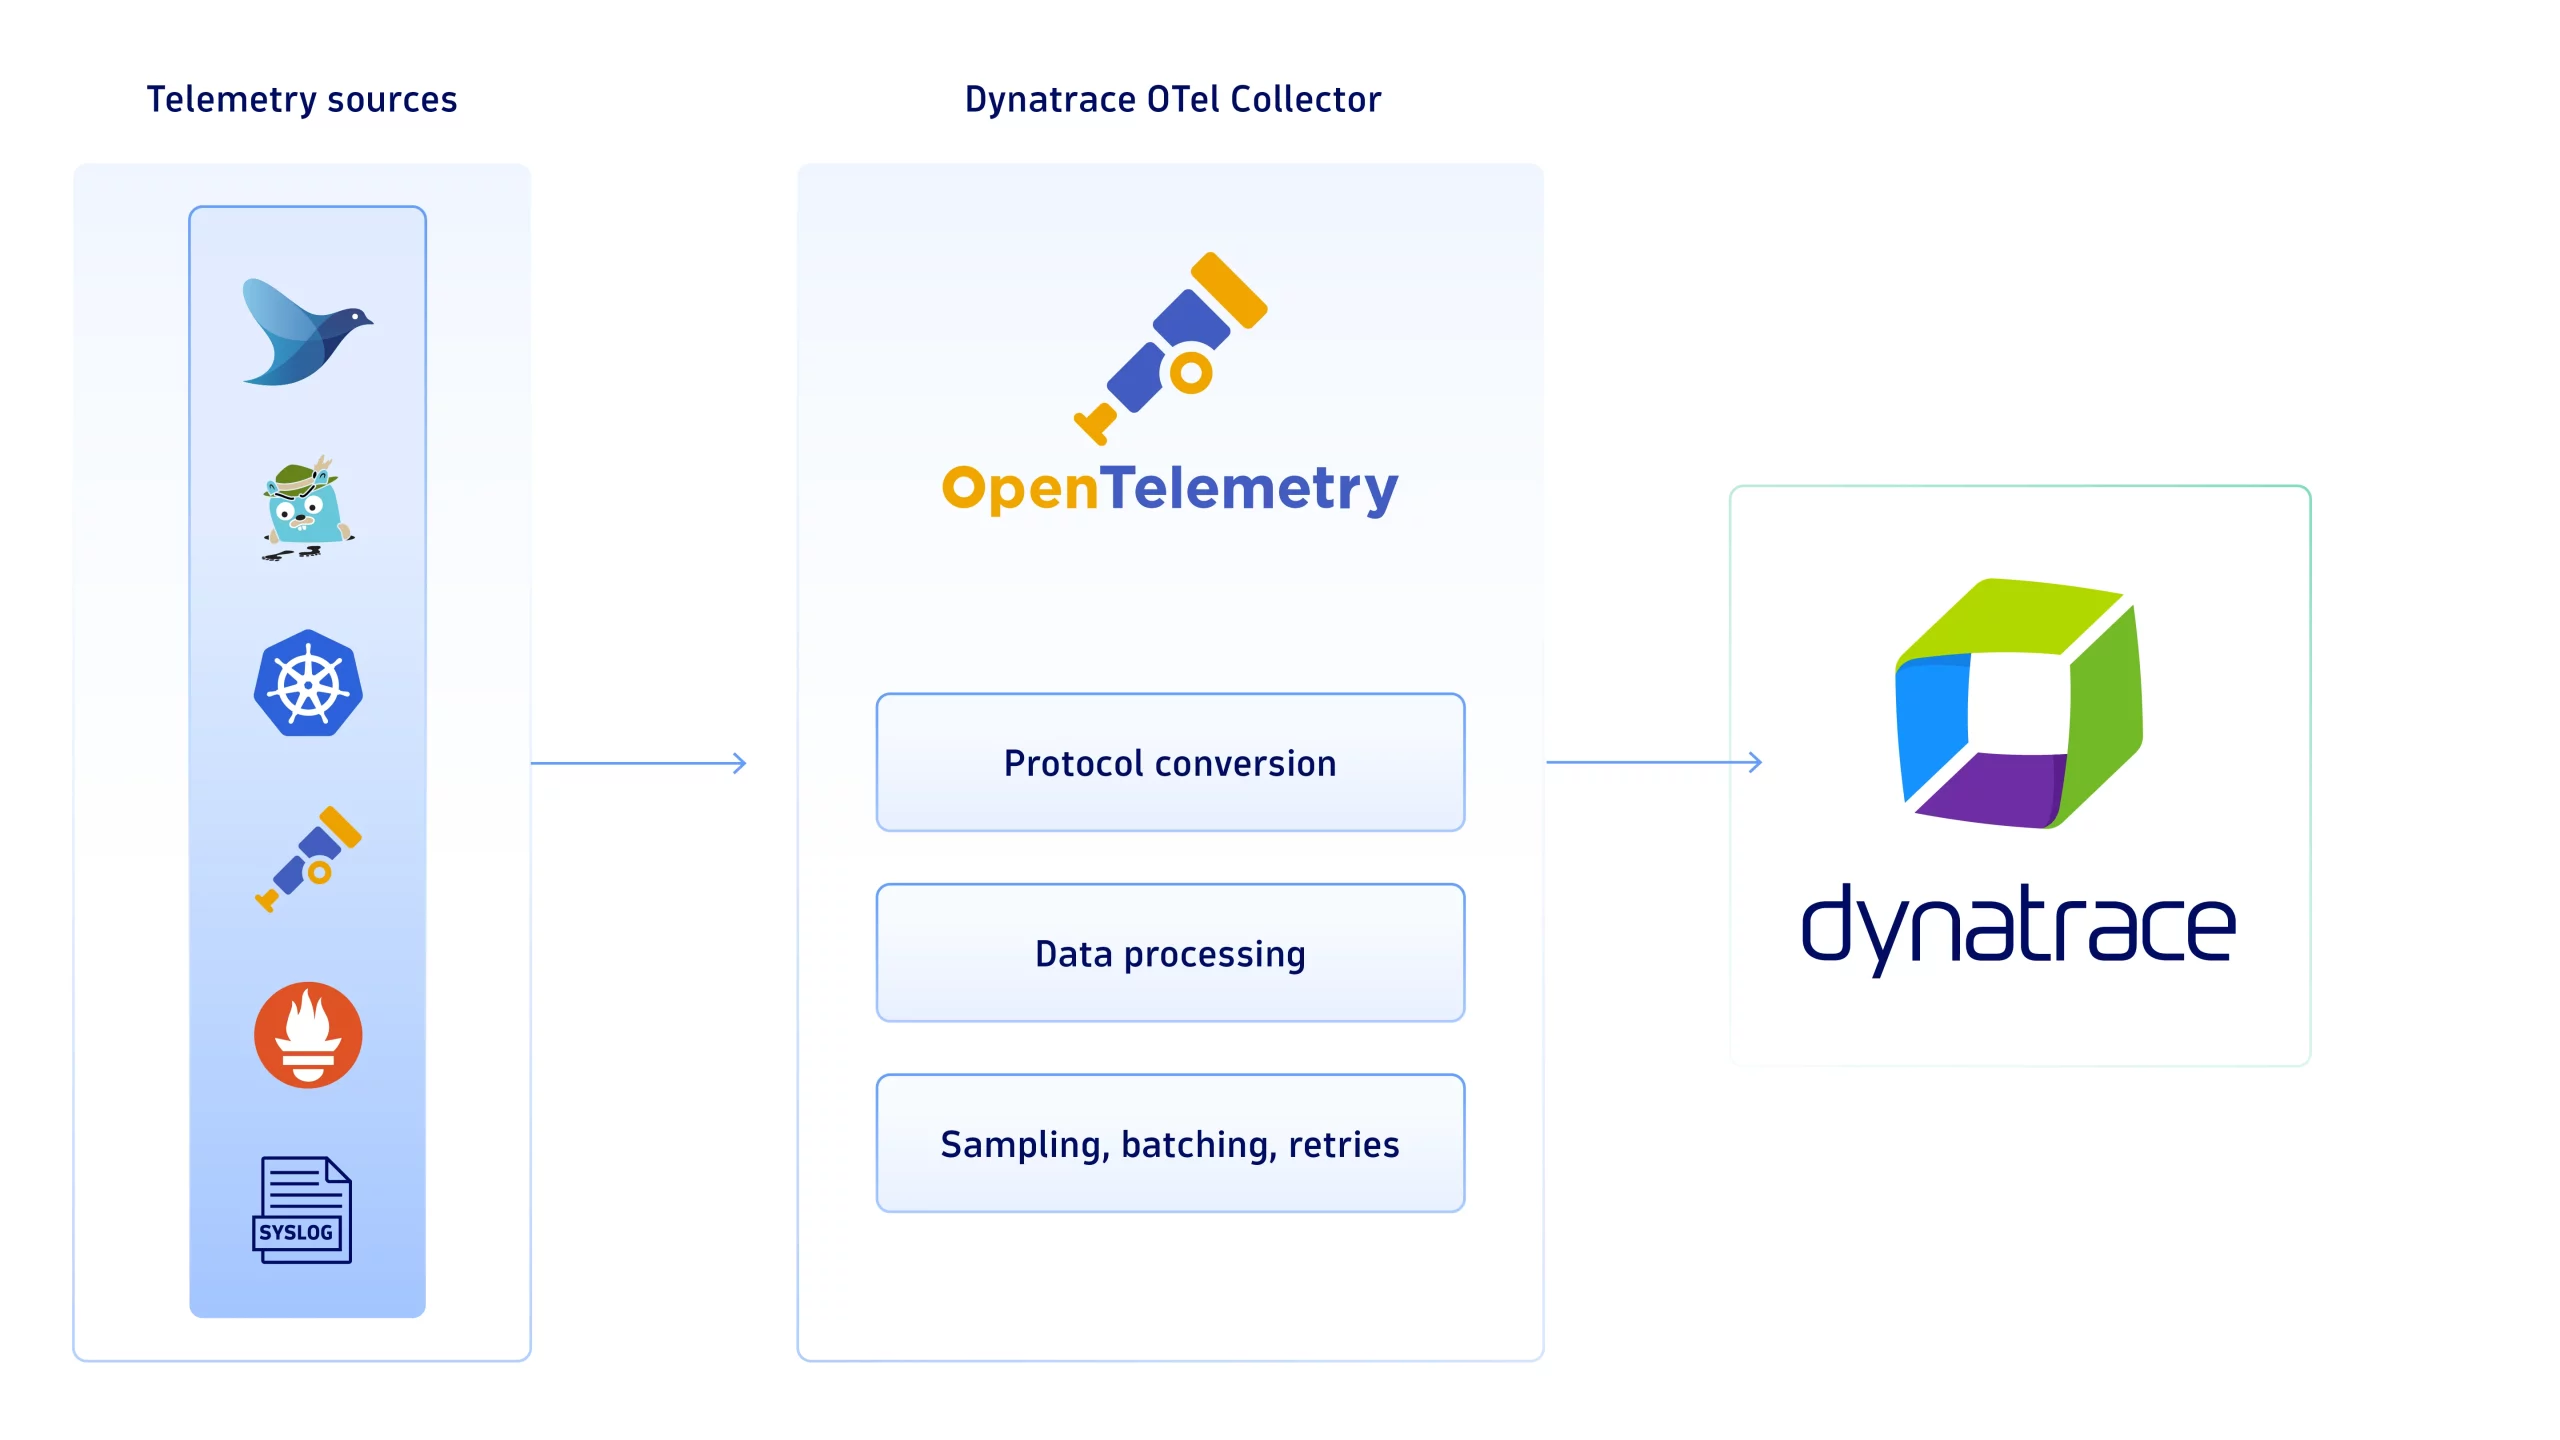
OpenTelemetry has become the industry standard for collecting and transmitting data, but many organizations struggle to fully leverage its capabilities. To strengthen this open standard further, Dynatrace provides a curated and supported OpenTelemetry collector. With the Dynatrace Otel Collector, teams gain a curated, validated integration framework that simplifies data collection and ensures reliability across diverse data sources from Syslog, fluentd®, Jaeger™, Prometheus®, StatsD, and more. You can find the list of use cases here.
 Dynatrace OTel Collector
Understand your applications with ease
Due to a lack of contextual insights and actionable intelligence, application teams often find themselves overwhelmed by data, unable to quickly identify the root causes of performance issues.
For Operations and SREs, the main task is to reduce downtime and service degradations—that is, to remediate issues as quickly as possible. Application teams, however, need more than surface-level data—they need actionable insights that pinpoint the root cause of issues, enabling faster and more effective problem resolution.
Visualize your application data
In complex application environments, visualizing data effectively is key to uncovering hidden performance trends and gaining actionable insight. Dynatrace provides rich visualizations, empowering application teams to interact with data more intuitively and accelerating their ability to identify and resolve issues.
Quickly achieve immediate value out of Dynatrace—new use cases and persona-driven experiences guarantee out-of-the-box value, easy onboarding, dedicated apps, and ready-made dashboards with rich visualizations. Interact with data intuitively and easily and benefit from immediate, AI-supported insights.

Trace your application
Imagine a microservices architecture with hundreds of dependencies. Without distributed tracing, pinpointing the cause of increased latency could take hours or even days. With Dynatrace, application teams can immediately see which services are experiencing delays, reducing the time to resolution and minimizing the impact on users.
Easily understand opportunities for performance optimization and troubleshooting with the new Dynatrace experience for Distributed Tracing. This experience provides visibility into complex, microservices-based architectures, allowing teams to Identify performance bottlenecks and optimize system reliability:
- Use a histogram view of response time distribution to pinpoint slowdowns
- Take advantage of direct interaction with tables for effortless grouping and filtering
- Streamline the feature flag analysis process
- Simplify testing procedures (for example, A/B testing)
Get access to intuitive troubleshooting:
- Simplified error and response time analysis with histograms covering failures and response times alongside dynamic analysis charts.
- Easy access to exception details in the context of a full trace for exception analysis
Expanded log insights for your applications
Only Dynatrace enables true and unified observability across all ingested logs, including infrastructure components and hyperscalers providing backend services or cloud-native frontend applications.
Dynatrace Grail™ data lakehouse is schema-on-read and indexless, built with scaling in mind. There is no need to think about schema and indexes, re-hydration, or hot/cold storage. This architecture also means you’re not required to determine your log data use cases beforehand or while analyzing logs within the new logs app.
The same is true when it comes to log ingestion. It doesn’t matter whether OneAgent®, OpenTelemetry, or another method is used. Dynatrace Davis® AI will process logs automatically, independent of the technique used for ingestion.
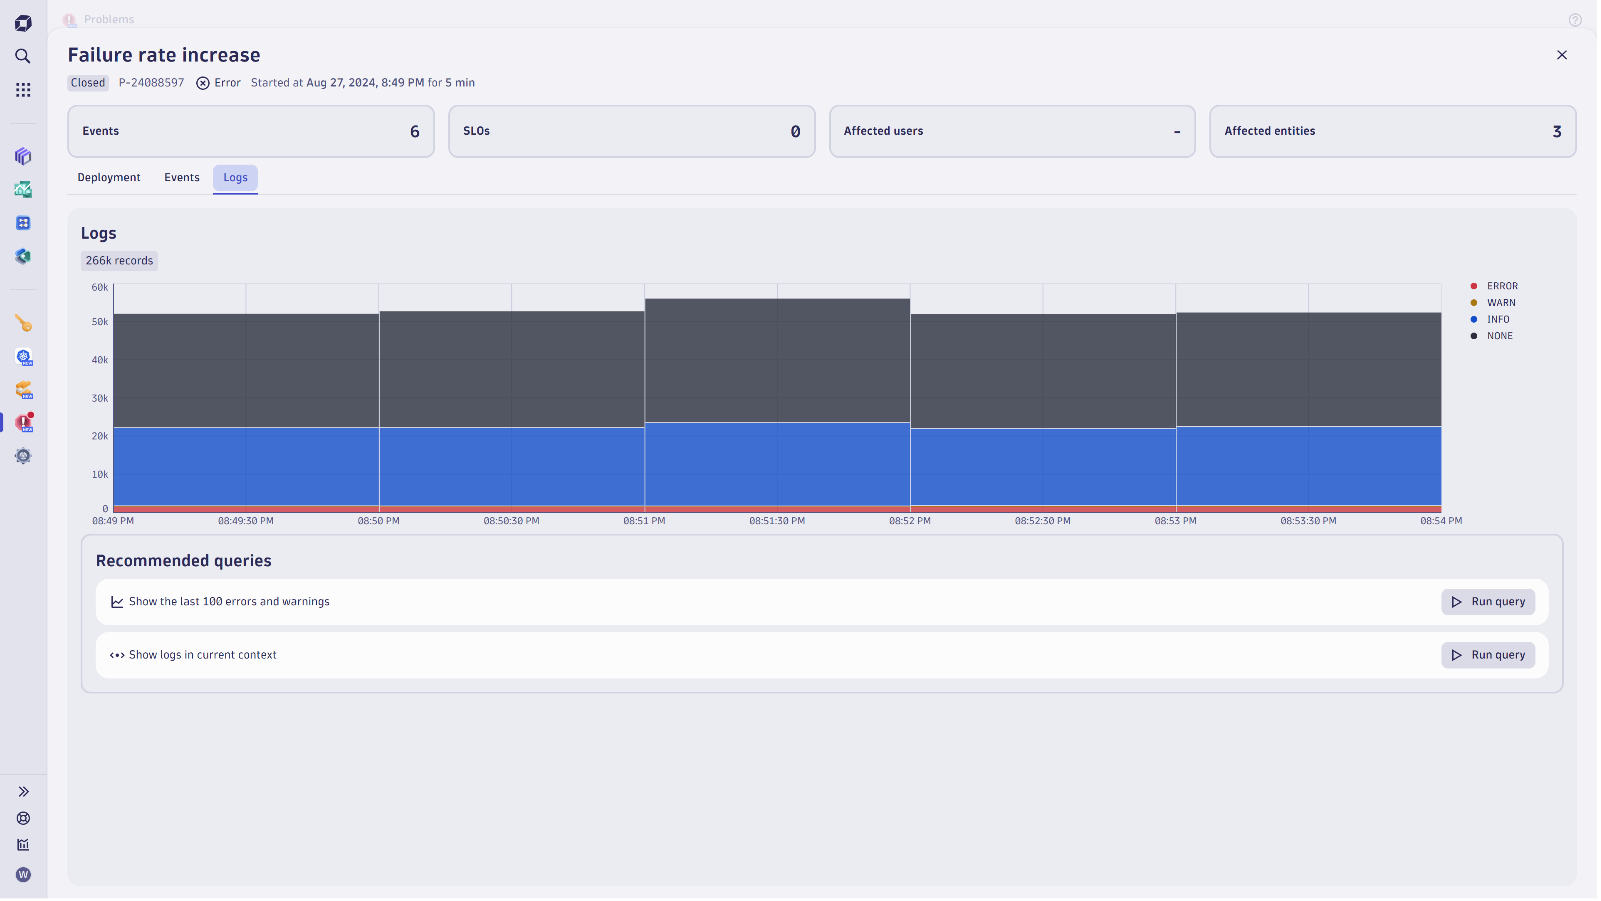
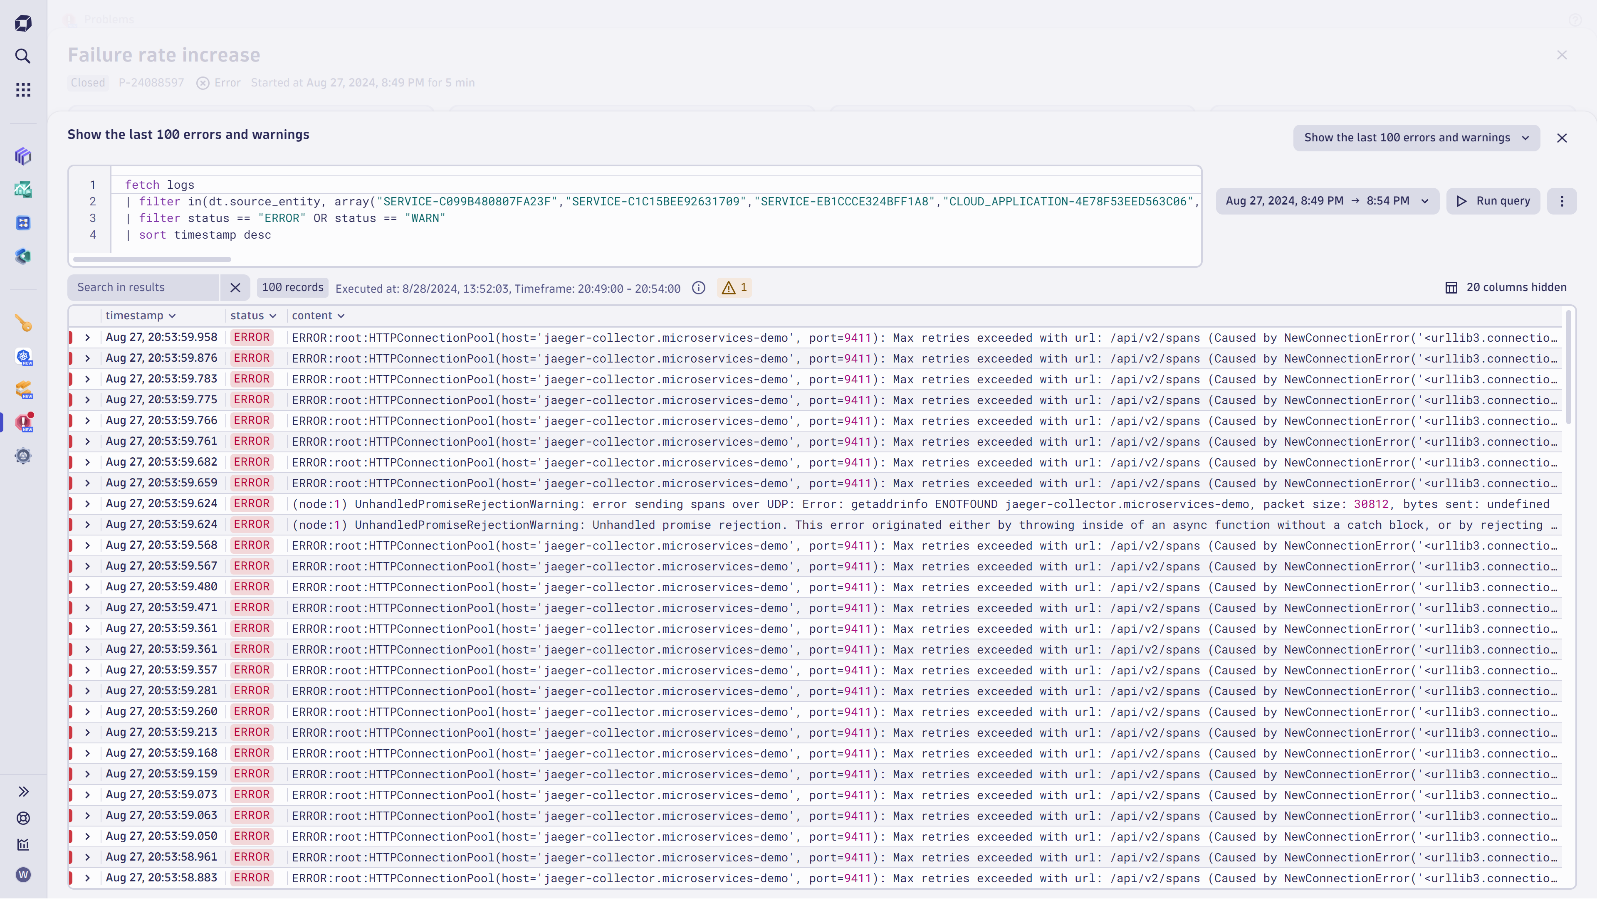
Speaking of log ingestion and OneAgent, one of the main differentiators compared to other market participants is the automatic detection and integration of technologies and the collection of the corresponding application or backend service logs. This empowers application teams to gain fast and relevant insights effortlessly, as Dynatrace provides logs in context, with all essential details and unique insights at speed. This eliminates the need for swapping tools or manual log correlation. In contrast, threat hunters, developers, or DevOps on the lookout for such a tool are provided the flexibility to manually analyze logs of all sources with the all-new Dynatrace Logs app. All of this without any complexity of re-hydration or re-ingestion of logs.
The benefits reaped are increased productivity and less likelihood of overlooking relevant log lines during timely investigations, as Davis AI automatically surfaces the pertinent details.


Analyze your data exploratively
Gathering further insights and answers from the treasure trove of data is conveniently achieved by accessing Dynatrace Grail with Notebooks, Davis AI, and data in context for advanced, exploratory analytics. Increase productivity and start automating your work with all related data in context.
Avoid flying blind by adopting software development lifecycle events
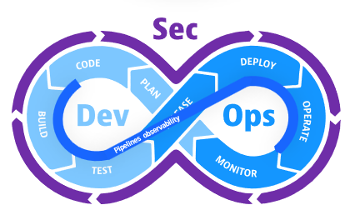
With the need for increased innovation frequency, having a clear view of the entire software development lifecycle (SDLC) is critical. The SDLC has similarities to the DevSecOps loop as it outlines the various phases a product idea undergoes before it’s released into production. While the lifecycle starts with a ticket specifying a new product idea, an actual code change often triggers various automated tasks kicking off the next phase. These automation tasks process the code change to build a deployable and create new artifacts accompanying the change throughout the delivery process.

Dynatrace defines the semantics of essential data points and stores them in a normalized manner. For instance, the Git commit, ticket ID, artifact version, release version, and deployment stage are data points that require special attention. With the semantics of this metadata, well-defined, stable applications, robust automation, and frictionless collaboration can be achieved.
Try it out yourself
The capabilities highlighted in this blog post will be available in Dynatrace SaaS environments in the coming weeks.
Collaborating with your peers based on your software development lifecycle and all data in context has never been easier.
 4 months ago
30